
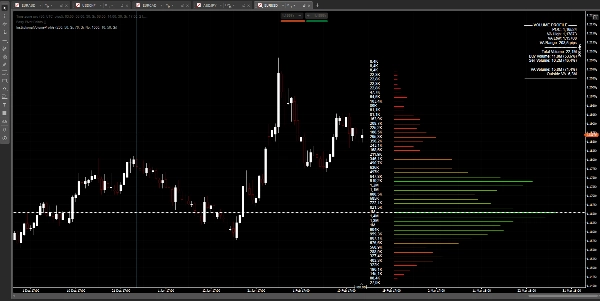
INSTITUTIONELLES VOLUMENPROFIL - Fortgeschrittenes Marktanalyse-Tool
Entdecken Sie, wo sich institutionelle Händler positionieren, mit diesem professionellen Volumenprofil-Indikator. Im Gegensatz zu einfachen Volumentools zeigt dieser Indikator die wahre Marktstruktur, indem er Ihnen genau zeigt, wo die Mehrheit der Handelsaktivität stattgefunden hat.
HAUPTMERKMALE:
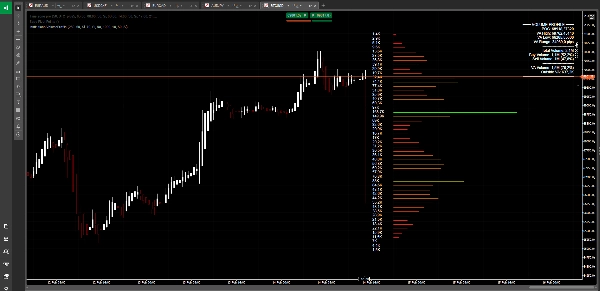
🎯 Point of Control (POC)
Identifizieren Sie sofort das Kursniveau mit dem höchsten Handelsvolumen – den Gleichgewichtspunkt des Marktes, an dem sich institutionelle Aktivitäten konzentrieren.
📊 Value Area Analyse
Visualisieren Sie die Preisspanne, die 70 % des gesamten Handelsvolumens enthält. Hier existiert der „faire Wert“ und der Preis neigt dazu, sich dorthin zu bewegen.
💹 Kauf-/Verkaufs-Sentiment-Analyse
Sehen Sie das Kräfteverhältnis zwischen Käufern und Verkäufern mit Echtzeit-Prozentangaben. Erkennen Sie, ob Bullen oder Bären die Kontrolle haben.
🎨 Intelligenter Farbverlauf
Zonen mit hohem Volumen erscheinen in leuchtendem Grün, während Bereiche mit geringem Volumen rot dargestellt werden. Erkennen Sie sofort Liquiditätszonen und potenzielle Ausbruchsbereiche.
📈 Professionelle Darstellung
Saubere, nicht aufdringliche Anzeige mit Volumenbalken, die sich von der Kursbewegung weg erstrecken. Zahlen sind klar positioniert für einfaches Ablesen auf jeder Zoomstufe.
⚙️ Vollständig anpassbar
Passen Sie den Betrachtungszeitraum, die Anzahl der Kursniveaus, Farben und Anzeigeoptionen an Ihren Handelsstil an.
PERFEKT FÜR:
• Identifizierung wichtiger Unterstützungs- und Widerstandsniveaus
• Erkennen von Low-Volume-Nodes (LVN) für potenzielle Ausbrüche
• Finden von High-Volume-Nodes (HVN), an denen sich der Preis konsolidieren kann
• Verständnis der institutionellen Positionierung
• Bestätigung von Handels-Einstiegen und -Ausstiegen
• Multi-Timeframe-Analyse
Egal, ob Sie Daytrader, Swingtrader oder Positionstrader sind, dieses Tool verschafft Ihnen den Vorteil, indem es Ihnen zeigt, was traditionelle Indikatoren nicht können: wo das kluge Geld agiert.
---
⚠️ RISIKOHINWEIS:
Der Handel mit Devisen, Kryptowährungen und anderen Finanzinstrumenten birgt ein hohes Risiko und ist möglicherweise nicht für alle Anleger geeignet. Der hohe Hebel kann sich sowohl zu Ihrem Vorteil als auch zu Ihrem Nachteil auswirken. Bevor Sie mit dem Handel beginnen, sollten Sie Ihre Anlageziele, Ihre Erfahrung und Ihre Risikobereitschaft sorgfältig prüfen. Es besteht die Möglichkeit, dass Sie einen Teil oder die gesamte Investition verlieren. Investieren Sie daher kein Geld, dessen Verlust Sie sich nicht leisten können. Sie sollten sich aller mit dem Handel verbundenen Risiken bewusst sein und im Zweifelsfall einen unabhängigen Finanzberater konsultieren. Die vergangene Wertentwicklung ist kein Indikator für zukünftige Ergebnisse.
5 | 33 % | |
4 | 33 % | |
3 | 0 % | |
2 | 33 % | |
1 | 0 % |


![„[Hamster-Coder] Pivot Points MTF“-Logo](https://cdn.ctrader.com/image/webp/4c143e5a-309c-40e3-a578-f04d1e133ffa_31159)


