

Beschreibung
BB20 Multicolor
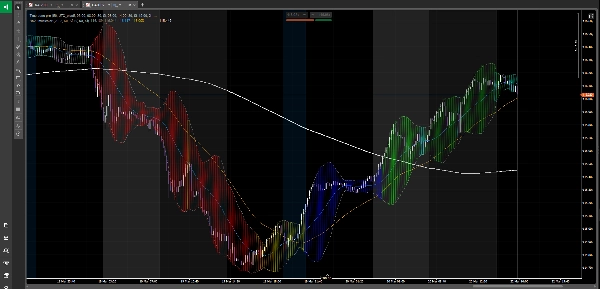
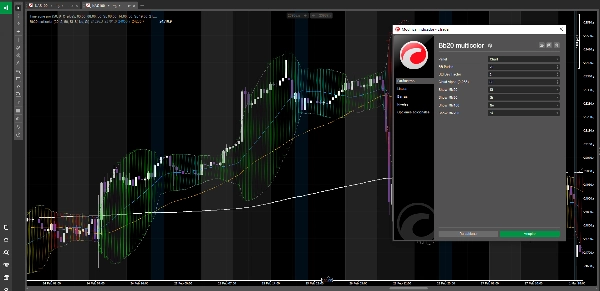
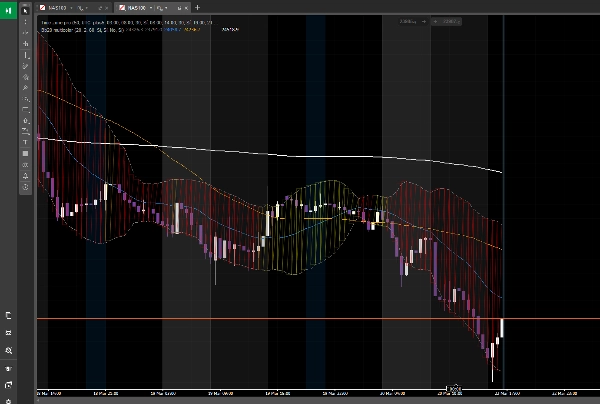
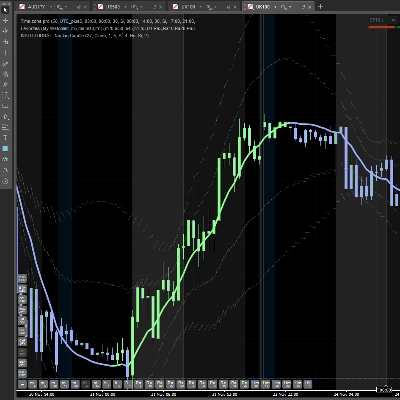
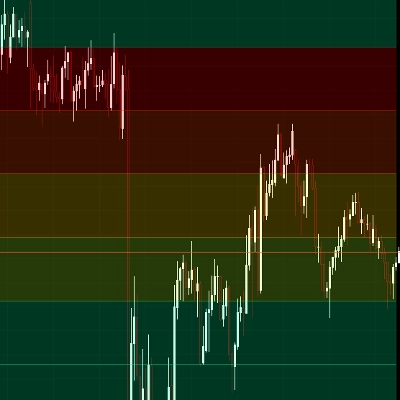
Ein leistungsstarker Indikator zur Identifizierung von Marktzyklen, der direkt auf Ihrem Chart überlagert wird und die Kursbewegungen in 8 verschiedene Marktphasen farblich codiert – von stark bärisch bis vollständig bullisch – basierend auf der Beziehung zwischen dem Kurs und vier wichtigen gleitenden Durchschnitten (MM20, MM50, MM100, MM200) in Kombination mit Bollinger-Bändern.
──────────────────────────
WIE ES FUNKTIONIERT
──────────────────────────
Der Indikator bewertet ständig die Position des Kurses relativ zu den vier gleitenden Durchschnitten und weist der Bollinger-Band-Cloud-Zone eine von 8 Farben zu, sodass Sie sofort eine visuelle Einschätzung der aktuellen Marktzyklusphase erhalten:
🔴 ROT — Klarer bärischer Trend
Der Kurs liegt unter MM200. Der Markt wird von Verkäufern dominiert. Bias: nur Short.
🟠 ORANGE — Technischer Rückprall
Der Kurs liegt unter MM200, hat sich aber über MM20 erholt. Ein Rückprall innerhalb eines bärischen Trends – keine Umkehr. Häufige Bullenfalle.
🟡 GELB — Zyklusphase 1
Der Kurs hat MM50 überschritten, aber die gleitenden Durchschnitte sind noch bärisch. Erste Anzeichen einer Erholung, noch nicht bestätigt.
🔵 BLAU — Versuch einer Trendwende
MM100 und MM50 liegen unter MM200, aber der Kurs beginnt, zwischen ihnen zu steigen. Hochvolatile Übergangszone – genau beobachten.
⬜ GRAU — Neutral / Abschwächung
Der Kurs liegt über MM200, aber unter MM100. Die langfristige Struktur ist noch bullisch, aber die Dynamik lässt nach. Vorsichtszone.
🟢 LIMETTENGRÜN — Zyklusphase 2
Kurs und MM50 liegen über MM200. Ein neuer bullischer Zyklus wird bestätigt. Viele institutionelle Händler beginnen hier mit der Positionierung.
🪵 TÜRKIS — Gesunde Konsolidierung
Der Kurs liegt über MM200 und MM100, zieht sich aber zurück in Richtung MM50 oder MM20. Eine normale Pause innerhalb eines bullischen Trends – potenzielle Wiedereinstiegszone.
🌲 DUNKELGRÜN — Ausgereifter bullischer Zyklus
Alle gleitenden Durchschnitte vollständig ausgerichtet: MM200 < MM50 < MM20 < Kurs. Sauberste Trendumgebung. Minimale Widerstände nach oben.
──────────────────────────
EIGENSCHAFTEN
──────────────────────────
• Cloud-Zonen werden nativ mit cTraders Chart.DrawTriangle für glatte, professionell aussehende Füllungen gerendert
• Bollinger-Bänder (obere und untere) werden zusammen mit der Cloud angezeigt
• Alle vier gleitenden Durchschnitte einzeln umschaltbar (MM20, MM50, MM100, MM200)
• Konfigurierbare BB-Periode, Standardabweichungsfaktor und Cloud-Transparenz
• Funktioniert mit jedem Instrument und jedem Zeitrahmen
• Vollständig Open Source – für immer kostenlos
──────────────────────────
ANWENDUNG
──────────────────────────
1. Verwenden Sie die Farbe als Markt-Kontextfilter, bevor Sie einen Trade eingehen
2. Suchen Sie nur nach Long-Positionen, wenn der Hintergrund grün ist (limettengrün oder dunkelgrün)
3. Suchen Sie nur nach Short-Positionen, wenn der Hintergrund rot oder orange ist
4. Verwenden Sie Gelb, Blau und Grau als Übergangszonen – reduzieren Sie die Positionsgröße oder warten Sie auf eine Bestätigung
5. Türkis ist Ihre Wiedereinstiegszone in einem etablierten bullischen Trend
Kompatibel mit jeder Handelsstrategie. Besonders effektiv in Kombination mit Kursbewegungen, Volumenanalyse oder stimmungsbasierten Ansätzen.
Installieren Sie ihn, legen Sie ihn auf Ihren Chart und wissen Sie sofort, in welcher Phase sich der Markt befindet.
⚠️ RISIKOHINWEIS
Der Handel mit Finanzinstrumenten birgt Risiken und ist nicht für jeden geeignet. Führen Sie stets Ihre eigene Analyse durch, verwalten Sie Ihr Risiko sorgfältig und handeln Sie niemals mit Geld, dessen Verlust Sie sich nicht leisten können.
Dieser Indikator ist ein Werkzeug der technischen Analyse – keine Finanzberatung. Verwenden Sie ihn mit Bedacht.
Zusammenfassung
- Red: Clear bearish trend (price below MM200)
- Orange: Technical bounce within bearish trend
- Yellow: Early recovery signs (price above MM50, but MAs bearish)
- Blue: Trend reversal attempt with high volatility
- Gray: Neutral or weakening momentum (price above MM200 but below MM100)
- Lime Green: Confirmed new bullish cycle (price and MM50 above MM200)
- Teal: Healthy consolidation in bullish trend (price above MM200 and MM100, pulling back)
- Dark Green: Mature bullish cycle with aligned moving averages
Features include native cloud rendering using cTrader's Chart.DrawTriangle, toggleable moving averages, configurable Bollinger Bands parameters, and compatibility with any instrument and timeframe. The indicator is open source and free to use. It serves as a market context filter to guide trade decisions, recommending long positions in green zones and shorts in red/orange zones, with caution advised in transition colors. It complements various trading strategies, including price action and volume analysis.
Kundenbewertungen
Diskussion
Häufig gestellte Fragen (FAQ)




















Preis