


説明
MACDに基づく価格予測
概要
このインジケーターは、従来のMACDの制限を突破し、過去の分析を超えて革新的に履歴記憶と統計アルゴリズムを導入し、将来の価格動向を予測します。
コアメカニズム:
- 履歴トレンド記憶:インジケーターは過去のMACDトレンド(強気および弱気)の価格変位を開始点に対して記録し、最大50の最近のトレンドの統計データベースを構築します。
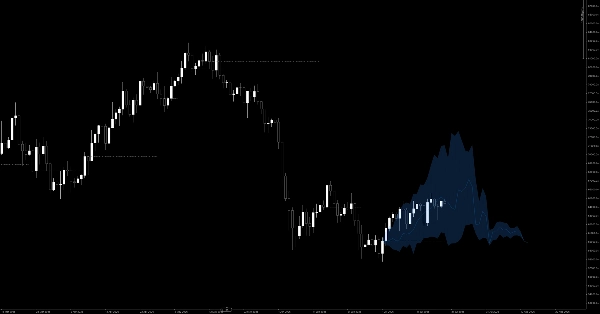
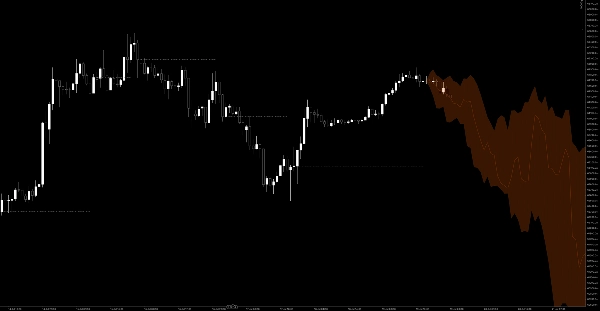
- 確率予測ファン:新しいMACDのクロスオーバー(ゼロラインまたはシグナルラインのいずれかを横切る)が発生すると、インジケーターは履歴記憶からデータを取得します。価格変動の20%、50%、80%パーセンタイルを計算し、チャートの右側に次の100本のバーのための確率予測ファンを投影します。
- 動的シグナルエリアクラウド:トレンド反転が始まった「参照価格」をマークします。リアルタイムの価格がこの参照価格を上回り上昇トレンドの場合、緑色のクラウドエリアを描画し、逆に下降トレンドでは赤いクラウドを描画します。これにより、実際の強気または弱気の勢いを即座に視覚的に確認できます。
(注:このインジケーターは高度に最適化されたグラフィックレンダリングを特徴としており、シームレスな多角形のブレンドによる明確な視覚ゾーンと、非常にクリーンなチャート体験のための洗練された不連続参照線を利用しています。)
取引ルール&ユーザーガイド
このインジケーターは単純な「クロスオーバーで買い/売り」シグナルを超え、確率的なロードマップを取引に提供します。
1. エントリーの見つけ方(トレンド確認)
- ロングエントリー:強気のMACDクロスオーバーが発生すると、右側に上向きに投影された青い予測ファンが表示されます。盲目的に飛び込まず、価格が点線(参照価格)を上回って安定し、緑色の強気クラウドが拡大し始めるのを待ちます。これにより、現在の勢いが強気の履歴統計と一致していることが確認され、押し目買いの良い機会となります。
- ショートエントリー:弱気のMACDクロスオーバーが発生すると、下向きに投影されたオレンジ色の予測ファンが表示されます。価格が参照線の下に留まり、拡大する赤い弱気クラウドが確認できれば、戻り売りのショートエントリーを検討します。
2. 利益確定目標の設定
予測ファンは優れた動的利益確定ガイドとして機能します:
- 目標1(ファンの中央線):ファン内の中央線は50%の履歴パーセンタイル(平均軌道)を表します。価格がこの線に触れると、現在の動きが履歴平均に達したことを意味し、部分利益確定に最適なポイントです。
- 目標2(ファンの外縁):上限(80%パーセンタイル)または下限(20%パーセンタイル)は履歴の極値を示します。価格がこれらの端に達すると、勢いが大幅に消耗しており、反転または大きな押し戻しが非常に高い確率で起こります。全ポジションの決済を検討してください。
3. 科学的なストップロス設定
- 灰色の破線(参照価格)はすべてのトレンドの基準線として機能します。
- ロングの場合は、この灰色の線の少し下にストップロスを置きます。価格が参照価格を下回り、緑のクラウドが消えた場合、実際の価格動向が履歴の強気確率を無効にしたことを意味します。トレンドセットアップは失敗しているため、すぐに損切りすべきです。
4. レンジ相場フィルター
- MACDクロスオーバーが発生しても、予測ファンが非常に平坦または収縮している場合、これは過去に類似のクロスオーバーがもみ合いの横ばい動きにしかつながらなかったことを意味します。
- 平坦なファンを見たら、手を出さずに次のサイクルまで待ち、ファンが明確に上昇または下降に拡大するのを待ちます。
概要
AI summary
MACD Based Price Forecasting is a technical indicator that extends traditional MACD analysis by incorporating historical memory and statistical algorithms to predict future price movements. It records price displacements from up to 50 recent MACD trends, both bullish and bearish, creating a statistical database for forecasting.
Key features include a probability forecasting fan that projects 20%, 50%, and 80% price change percentiles for the next 100 bars following a MACD crossover. The indicator visually displays this fan on the chart, with blue fans for bullish signals and orange for bearish. A dynamic signal area cloud highlights momentum: green for confirmed uptrends above a reference price and red for downtrends below it.
Trading guidance involves waiting for price confirmation above or below the reference price and cloud before entering long or short positions. The forecasting fan also serves as a dynamic take-profit guide, with the middle line representing average historical moves and outer edges indicating potential trend exhaustion. Stop-loss placement is recommended just beyond the reference price line to manage risk.
Additionally, the indicator filters ranging markets by identifying flat or contracted fans, signaling sideways price action and advising traders to avoid entering trades during such periods. The indicator supports visualization outputs and is tagged under MACD and momentum indicators.
Key features include a probability forecasting fan that projects 20%, 50%, and 80% price change percentiles for the next 100 bars following a MACD crossover. The indicator visually displays this fan on the chart, with blue fans for bullish signals and orange for bearish. A dynamic signal area cloud highlights momentum: green for confirmed uptrends above a reference price and red for downtrends below it.
Trading guidance involves waiting for price confirmation above or below the reference price and cloud before entering long or short positions. The forecasting fan also serves as a dynamic take-profit guide, with the middle line representing average historical moves and outer edges indicating potential trend exhaustion. Stop-loss placement is recommended just beyond the reference price line to manage risk.
Additionally, the indicator filters ranging markets by identifying flat or contracted fans, signaling sideways price action and advising traders to avoid entering trades during such periods. The indicator supports visualization outputs and is tagged under MACD and momentum indicators.
インジケーターのプロフィール
インジケーターのカテゴリー
トレンド
出力の種類
ビジュアル表示
データ要件
バーのみ
取引高
ティックデータ
サポート対象のシグナル
クロス
ダイバージェンス
ブレイクアウト
反転
トレンドの強さ
ボラティリティ
カスタマーレビュー
0.0
レビュー: 0
カスタマーレビュー
この商品にはまだレビューがありません。お使いになったことがある方は、ぜひレビューをお願いします。
ディスカッション
よくあるご質問
MACD
cTrader Storeで入手可能な取引ボット、インジケーター、プラグインなどの商品は、第三者の開発者が提供するものであり、情報と技術の取得のみを目的としてご利用いただけます。cTrader Storeはブローカーではなく、投資助言や個人的な推奨を行うことも、将来のパフォーマンスを保証することもありません。
この作成者の他の商品






















価格
534.4M
取引数量
9.76M
獲得pips
4
販売