
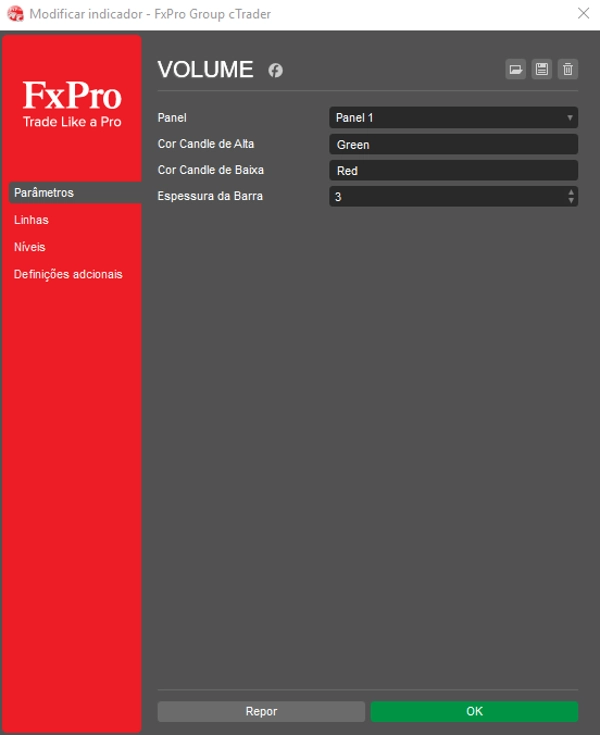
VolumeColorBar
อินดิเคเตอร์
10 การซื้อ
เวอร์ชัน 1.2, Apr 2026
Windows, Mac
4.3
รีวิว: 3
คำอธิบาย
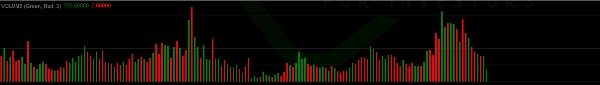
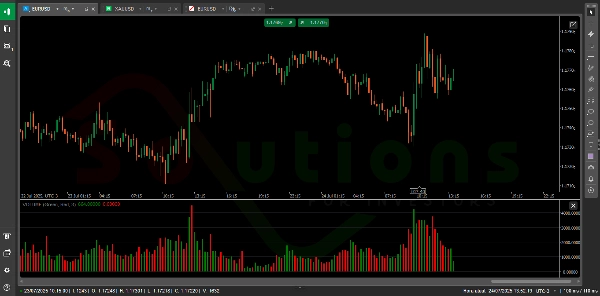
VolumeColorBar เป็นเครื่องมือที่ทรงพลังซึ่งแสดงปริมาณตลาดด้วยแถบสีที่กำหนดตามทิศทางของแท่งเทียน แถบสีเขียวแสดงถึงปริมาณในแท่งเทียนขาขึ้น (แรงกดดันจากการซื้อ) ขณะที่แถบสีแดงแสดงถึงปริมาณในแท่งเทียนขาลง (แรงกดดันจากการขาย) ซึ่งช่วยให้นักเทรดสามารถประเมินได้ทันทีว่ากิจกรรมในตลาดถูกขับเคลื่อนโดยผู้ซื้อหรือผู้ขายมากกว่ากัน — ช่วยยืนยันการเบรกเอาท์ ระบุการกลับตัว และปรับปรุงเวลาการเทรดด้วยความมั่นใจมากขึ้น
สรุป
สรุปโดย AI
VolumeColorBar is a trading indicator that visualizes market volume using color-coded bars aligned with candle direction. It displays green bars for volume on bullish candles, indicating buying pressure, and red bars for volume on bearish candles, indicating selling pressure. This visual representation helps traders quickly assess whether market activity is dominated by buyers or sellers. The indicator supports various markets and symbols, including Forex pairs (EURUSD, GBPUSD, NZDUSD, USDJPY), cryptocurrencies (BTCUSD, crypto), commodities (XAUUSD, gold, oil, silver), indices (NAS100, SP500, DAX, Dow), and stocks. By providing immediate insight into volume dynamics relative to price movement, VolumeColorBar aids in confirming breakouts, identifying potential reversals, and improving trade timing decisions.
โปรไฟล์อินดิเคเตอร์
รีวิวจากลูกค้า
4.3
รีวิว: 3
5 | 33 % | |
4 | 67 % | |
3 | 0 % | |
2 | 0 % | |
1 | 0 % |
รีวิวจากลูกค้า
April 14, 2025
Clean tool for workflow for a more controlled workflow. It helps with planning entries around the first range, but false breaks still need filtering. I would track 20 market opens, the first 30 to 60 minutes and a target near 1.5R. I would still keep manual review in the process.
April 13, 2025
April 13, 2025
Worth a closer look around opening range breakouts. The useful part is planning entries around the first range, with the numbers checked before scaling. The setup should be tested across at least 15 sessions because 2 or 3 fakeouts can change the picture. The trade idea is clear, but it needs a hard stop and a defined breakout rule.
การสนทนา
คำถามที่พบบ่อย
BTCUSD
Forex
Signal
Breakout
Indices
EURUSD
Commodities
GBPUSD
NZDUSD
Prop
Crypto
Stocks
XAUUSD
NAS100
USDJPY
ผลิตภัณฑ์ที่มีให้บริการผ่าน cTrader Store รวมถึงบอทการเทรด อินดิเคเตอร์ และปลั๊กอิน มีให้บริการโดยนักพัฒนาบุคคลที่สามและมีไว้เพื่อวัตถุประสงค์ในการเข้าถึงข้อมูลและทางเทคนิคเท่านั้น cTrader Store ไม่ใช่โบรกเกอร์และไม่ได้ให้คำแนะนำการลงทุน คำแนะนำส่วนบุคคล หรือการรับประกันผลการดำเนินงานในอนาคต


ราคา
ตั้งแต่ 05/02/2025
31
การขาย