
Beschreibung
Benutzerdefinierter RSI – Spot-Umkehrungen mit Präzision und klarem Design
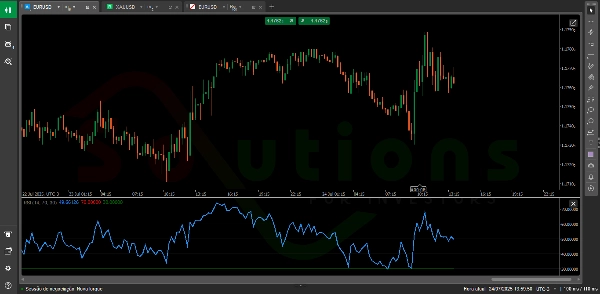
Benutzerdefinierter RSI ist eine verbesserte Version des klassischen Relative Strength Index (RSI), entwickelt, um Händlern zu helfen, schnell überkaufte und überverkaufte Zonen zu identifizieren – Schlüsselbereiche, in denen der Preis wahrscheinlich umkehrt.
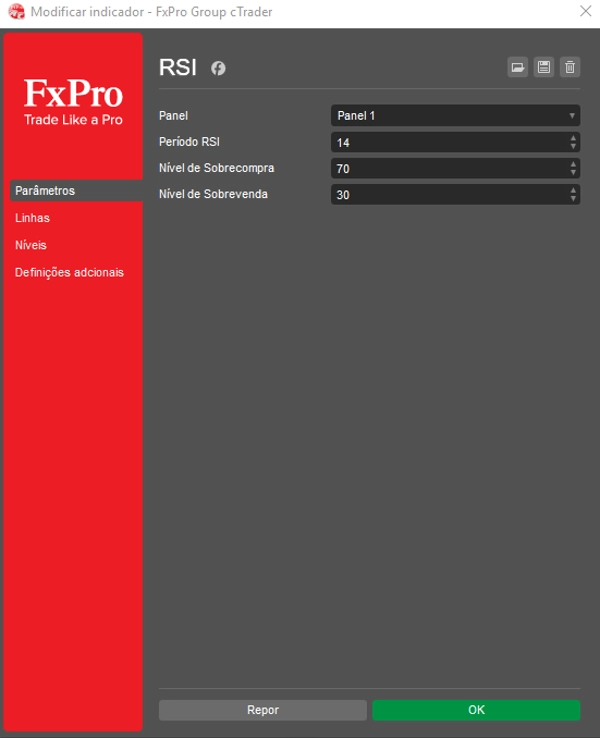
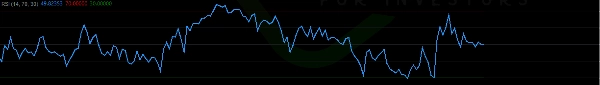
Mit einer klaren und intuitiven Benutzeroberfläche zeigt es zwei vollständig anpassbare horizontale Linien (wie die traditionellen 70- und 30-Level) an, die deutlich hochwahrscheinliche Entscheidungsbereiche im Chart markieren.
✅ Passen Sie den Zeitrahmen und die RSI-Level an Ihren Handelsstil an
✅ Erkennen Sie potenzielle Umkehrzonen mit größerem Vertrauen
✅ Verbessern Sie Ihre technische Analyse mit einem klaren, übersichtlichen Indikator
Perfekt für Händler aller Erfahrungsstufen, Benutzerdefinierter RSI verwandelt Rohpreisdaten in intelligente, umsetzbare Erkenntnisse – und ist damit ein unverzichtbares Werkzeug für profitable Entscheidungen.
Zusammenfassung
Kundenbewertungen
5 | 0 % | |
4 | 100 % | |
3 | 0 % | |
2 | 0 % | |
1 | 0 % |


![„[Stellar Strategies] MARSI Signal Plotter“-Logo](https://cdn.ctrader.com/image/webp/7b2b8da6-8f8e-4646-8d4a-4710c516c01e_25567)


