
VegaXLR - RSI and StochRSI Alerts
อินดิเคเตอร์
15 การซื้อ
เวอร์ชัน 1.0, Apr 2025
Windows, Mac
5.0
รีวิว: 3
คำอธิบาย
VegaXLR - RSI and StochRSI Alerts เป็นตัวบ่งชี้ cTrader ที่ให้การแจ้งเตือนสำหรับเหตุการณ์ RSI และ StochRSI เพื่อให้ผู้ซื้อขายได้รับข้อมูลเกี่ยวกับการเปลี่ยนแปลงของตลาด มันแจ้งเตือนผู้ใช้เกี่ยวกับระดับการซื้อมากเกินไป/ขายมากเกินไป การข้ามเส้นศูนย์กลาง และการข้ามเส้น K/D ทั้งหมดนี้มาพร้อมกับการตั้งค่าที่ปรับแต่งได้
คุณสมบัติหลัก:
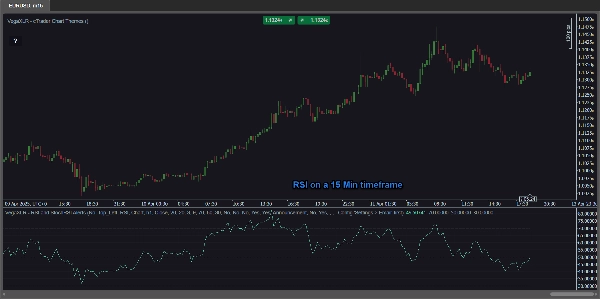
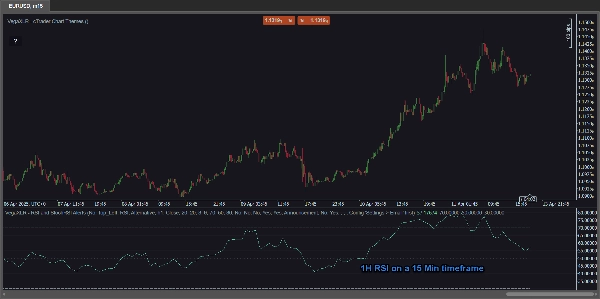
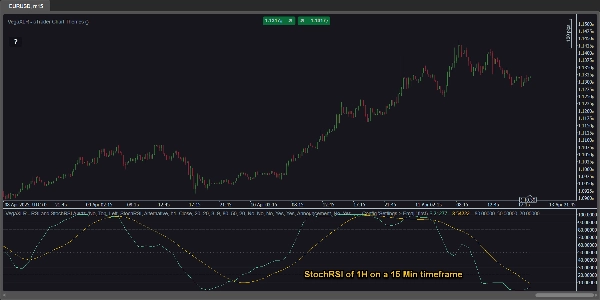
- การวิเคราะห์หลายกรอบเวลา: ดูค่า RSI และ StochRSI จาก กรอบเวลาใดก็ได้ โดยตรงบนแผนภูมิปัจจุบันของคุณ ตัวอย่างเช่น วิเคราะห์ RSI 1 ชั่วโมงในขณะที่ดูแผนภูมิ 15 นาที—โดยไม่ต้องเปลี่ยนกรอบเวลาแผนภูมิของคุณ!
- การแจ้งเตือน RSI & StochRSI: รับการแจ้งเตือนสำหรับ:
-
- สภาวะซื้อมากเกินไป & ขายมากเกินไป
- การข้ามเส้นศูนย์กลาง (50%)
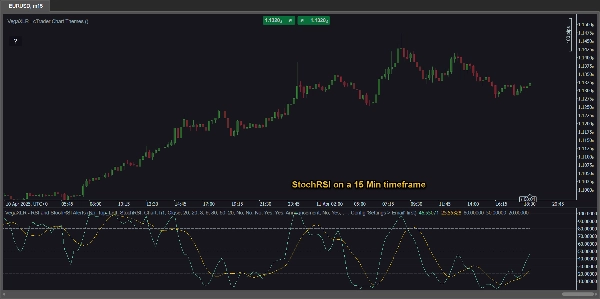
- การข้ามเส้น K และ D (StochRSI)
- การตั้งค่าที่ปรับแต่งได้: ปรับแหล่งที่มาของ RSI, ช่วงเวลา, ค่าของ K/D และเกณฑ์การแจ้งเตือนเพื่อการควบคุมที่แม่นยำ
- การแจ้งเตือนที่หลากหลาย: เลือกจาก:
-
- ป๊อปอัพ cTrader
- เสียงแจ้งเตือน
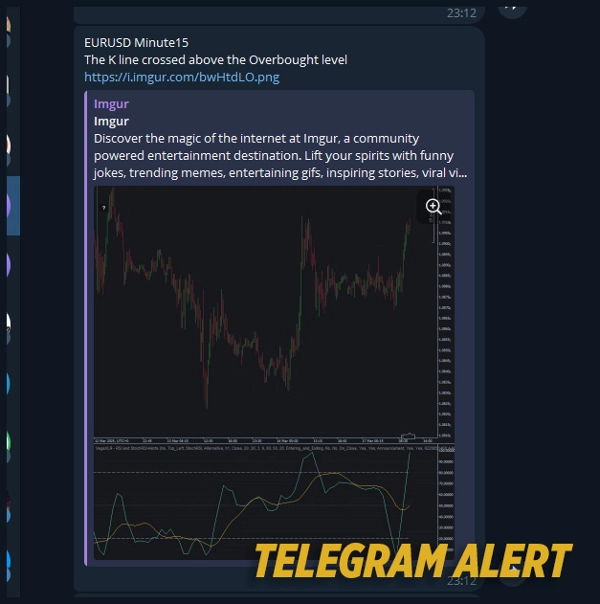
- การแจ้งเตือน Telegram (พร้อมภาพหน้าจอแผนภูมิตามต้องการ)
- การแจ้งเตือนทางอีเมล
- เส้น RSI & StochRSI ที่รวมอยู่: ไม่จำเป็นต้องใช้ตัวบ่งชี้เพิ่มเติม—พวกมันถูกสร้างไว้ในตัว!
คู่มือการเข้าถึงทันที: ปุ่มในแผนภูมิที่สะดวกเปิดคู่มือผู้ใช้
สรุป
สรุปโดย AI
VegaXLR - RSI and StochRSI Alerts is a cTrader indicator designed to monitor and notify traders of key RSI and StochRSI events. It provides alerts for overbought and oversold conditions, centerline (50%) crossovers, and K/D line crossovers within the StochRSI. The indicator supports multi-timeframe analysis, allowing users to view RSI and StochRSI values from any timeframe directly on their current chart without switching timeframes. Customizable settings enable adjustment of RSI source, periods, K/D values, and alert thresholds for tailored monitoring. Alert delivery options include cTrader popups, sound alerts, Telegram notifications (with optional chart screenshots), and email messages. The indicator integrates RSI and StochRSI lines internally, eliminating the need for additional indicators. An in-chart button provides instant access to the user manual for guidance. This tool assists traders in identifying precise market shifts and potential trade entry points based on momentum indicators.
โปรไฟล์อินดิเคเตอร์
รีวิวจากลูกค้า
5.0
รีวิว: 3
5 | 100 % | |
4 | 0 % | |
3 | 0 % | |
2 | 0 % | |
1 | 0 % |
รีวิวจากลูกค้า
April 27, 2025
Steady choice for testing for traders who use momentum confirmation. It gives value around oscillator setups, but strong trends can keep signals stretched. A clean test needs 25 oscillator signals, 2 timeframe confirmation and a clear 1R exit plan. The tool is useful when overbought or oversold is treated as context, not a command.
April 26, 2025
April 26, 2025
Good enough to inspect for oscillator setups. it gives a familiar read on overextension and momentum, especially when used for checking stretched conditions before entries. RSI style levels around 30 and 70 help, but I would add a 2 swing divergence check. The tool is useful when overbought or oversold is treated as context, not a command.
การสนทนา
คำถามที่พบบ่อย
RSI
ผลิตภัณฑ์ที่มีให้บริการผ่าน cTrader Store รวมถึงบอทการเทรด อินดิเคเตอร์ และปลั๊กอิน มีให้บริการโดยนักพัฒนาบุคคลที่สามและมีไว้เพื่อวัตถุประสงค์ในการเข้าถึงข้อมูลและทางเทคนิคเท่านั้น cTrader Store ไม่ใช่โบรกเกอร์และไม่ได้ให้คำแนะนำการลงทุน คำแนะนำส่วนบุคคล หรือการรับประกันผลการดำเนินงานในอนาคต


!["High-Low Divergence [Iridio Capital]" โลโก้](https://cdn.ctrader.com/image/webp/443c4661-7abb-40f1-842f-4b6ec560649b_40914)


ราคา
215
การขาย
677
ติดตั้งฟรี