
LT_FairValueGap
อินดิเคเตอร์
1 การซื้อ
เวอร์ชัน 1.0, Jun 2025
Windows, Mac
5.0
รีวิว: 1
คำอธิบาย
หมายเหตุ: ทดสอบบน cTrader Windows เท่านั้น
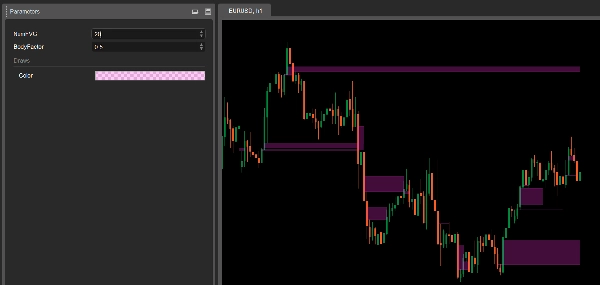
LT_FairValueGap เป็นตัวบ่งชี้ Fair Value Gap ที่เบาและทรงพลัง ออกแบบมาสำหรับเทรดเดอร์ที่เน้นความแม่นยำในการเคลื่อนไหวของราคา โดยเน้นโซนความไม่สมดุลแบบสถาบันโดยใช้ตรรกะ 3 แท่งอย่างเข้มงวด และลบโซนเหล่านั้นเมื่อราคากลับมาที่ช่องว่าง — มอบโซนที่ชัดเจนและใช้งานได้สำหรับการเข้าออกหรือความสอดคล้อง
🔍 วิธีการทำงาน
- Fair Value Gap (FVG) ถูกระบุเมื่อแท่งกลางที่แข็งแกร่ง (มีตัวแท่งใหญ่) สร้างความไม่สมดุลระหว่างแท่งสองแท่งที่อยู่ติดกัน
- ช่องว่างถูกทำเครื่องหมายเป็นโซน แนวรับ/แนวต้านชั่วคราว (SR).
- เมื่อราคากลับมาและเติมช่องว่าง โซนจะไม่ขยายต่ออีก — เพื่อให้กราฟไม่รกและเกี่ยวข้อง
⚙️ พารามิเตอร์
- NumFVG: จำนวนสูงสุดของโซน FVG ที่จะแสดงบนกราฟ
- BodyFactor: เกณฑ์ความแข็งแกร่งสำหรับแท่งกลาง (ค่าเริ่มต้น:
2.0×ตัวแท่งเฉลี่ยของแท่ง 20 แท่งล่าสุด)
✅ คุณสมบัติหลัก
- การตรวจจับช่องว่างแบบสถาบัน (ตรรกะ 3 แท่ง)
- กราฟที่สะอาด — โซนหยุดขยายเมื่อถูกแตะ
- ปรับความไวได้ผ่าน BodyFactor
- ใช้งานง่าย: การตั้งค่าน้อยที่สุด
📌 กรณีการใช้งาน
- ระบุความไม่สมดุลและโซนปฏิกิริยาแบบสถาบัน
- ใช้เป็นจุดสอดคล้องสำหรับการเข้าเทรดหรือเครื่องหมายยกเลิก
- ผสมผสานกับโครงสร้างสวิงหรือเครื่องมือวอลุ่ม
ไม่ว่าคุณจะเทรดเบรกเอาต์ การบรรเทา หรือการกลับตัว LT_FairValueGap ช่วยให้คุณเห็นโซนความไม่สมดุลที่แท้จริงที่สำคัญ — โดยไม่มีเสียงรบกวน
สรุป
โปรไฟล์อินดิเคเตอร์
รีวิวจากลูกค้า
5.0
รีวิว: 1
5 | 100 % | |
4 | 0 % | |
3 | 0 % | |
2 | 0 % | |
1 | 0 % |
รีวิวจากลูกค้า
June 25, 2025
Ngl, market notes are quicker to compare and that is enough to keep testing it. It should not replace the chart.
การสนทนา
คำถามที่พบบ่อย
Forex
ผลิตภัณฑ์ที่มีให้บริการผ่าน cTrader Store รวมถึงบอทการเทรด อินดิเคเตอร์ และปลั๊กอิน มีให้บริการโดยนักพัฒนาบุคคลที่สามและมีไว้เพื่อวัตถุประสงค์ในการเข้าถึงข้อมูลและทางเทคนิคเท่านั้น cTrader Store ไม่ใช่โบรกเกอร์และไม่ได้ให้คำแนะนำการลงทุน คำแนะนำส่วนบุคคล หรือการรับประกันผลการดำเนินงานในอนาคต


ราคา
ตั้งแต่ 25/09/2024
34
การขาย