
New Way Sar - Pro
อินดิเคเตอร์
3 การซื้อ
เวอร์ชัน 1.0, Sep 2025
Windows, Mac
4.5
รีวิว: 2
คำอธิบาย
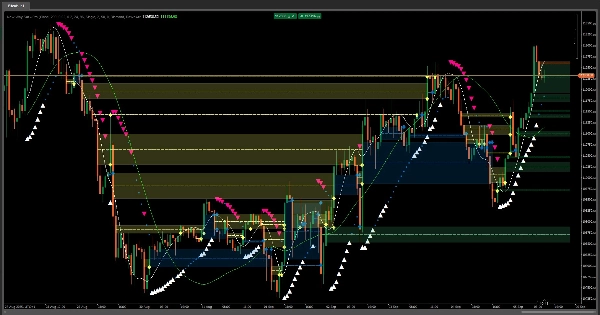
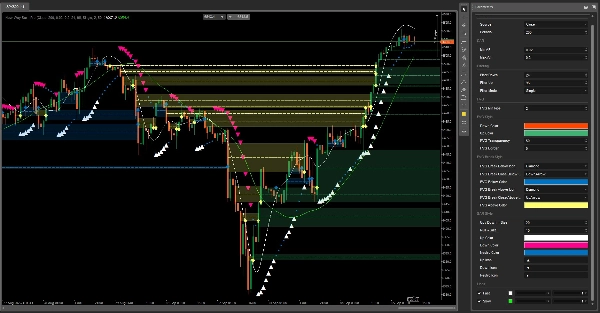
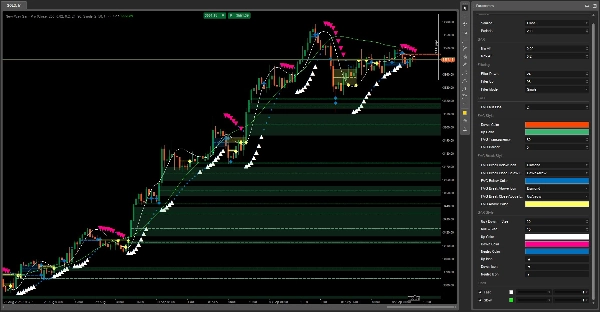
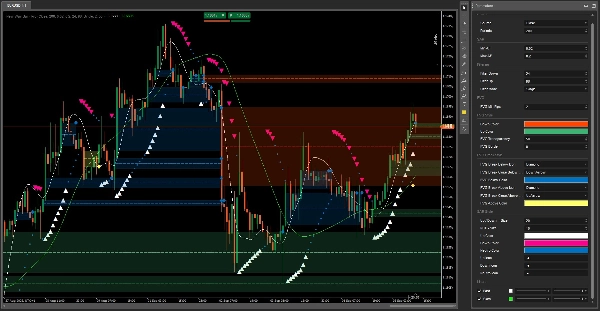
Parabolic SAR หรือที่เรียกว่า "หยุดและกลับทิศทาง" เป็นเครื่องมือวิเคราะห์ทางเทคนิคแบบไดนามิกที่ช่วยให้นักเทรดระบุการกลับตัวของแนวโน้มที่เป็นไปได้และตั้งคำสั่งหยุดขาดทุนแบบติดตามราคา แตกต่างจากตัวบ่งชี้แบบดั้งเดิม Parabolic SAR สร้างชุดจุดที่ติดตามการเคลื่อนไหวของราคา โดยปรับเปลี่ยนตามแรงของแนวโน้มที่เพิ่มขึ้น
เวอร์ชันสมัยใหม่ของเรานำเสนอวิธีการที่สดใหม่และเข้าใจง่ายสำหรับตัวบ่งชี้คลาสสิกนี้ โดยผสมผสานสัญญาณที่ทรงพลังและเชื่อถือได้เข้ากับการออกแบบที่สะอาดและทันสมัย ช่วยให้นักเทรดมองเห็นทิศทางแนวโน้มและจุดเข้าออกที่เป็นไปได้ได้อย่างง่ายดาย ด้วยการรวมระดับตลาดสำคัญเช่น Fair Value Gaps เวอร์ชันนี้จึงมอบระบบที่ครอบคลุมสำหรับการตัดสินใจเทรดที่แม่นยำและมั่นใจมากขึ้น มอบความชัดเจนที่คุณต้องการเพื่อเดินหน้าตลาดด้วยความมั่นใจ
สรุป
โปรไฟล์อินดิเคเตอร์
รีวิวจากลูกค้า
4.5
รีวิว: 2
5 | 50 % | |
4 | 50 % | |
3 | 0 % | |
2 | 0 % | |
1 | 0 % |
รีวิวจากลูกค้า
October 8, 2025
Smooth and smart SAR! 🔄 Adapts to volatility, cuts false flips, and keeps your trades on trend. Perfect for swing and trend lovers who want cleaner signals without the noise."
September 18, 2025
A calm trader gets value from weak ideas are easier to skip. It can look better than it is during a lucky run.
การสนทนา
คำถามที่พบบ่อย
Prop
Forex
Signal
Scalping
Indices
Supertrend
Commodities
Crypto
Stocks
ผลิตภัณฑ์ที่มีให้บริการผ่าน cTrader Store รวมถึงบอทการเทรด อินดิเคเตอร์ และปลั๊กอิน มีให้บริการโดยนักพัฒนาบุคคลที่สามและมีไว้เพื่อวัตถุประสงค์ในการเข้าถึงข้อมูลและทางเทคนิคเท่านั้น cTrader Store ไม่ใช่โบรกเกอร์และไม่ได้ให้คำแนะนำการลงทุน คำแนะนำส่วนบุคคล หรือการรับประกันผลการดำเนินงานในอนาคต


!["[CB] Pivot Points Pro" โลโก้](https://cdn.ctrader.com/image/webp/43463c82-67b0-4f10-a4ba-901bba091d81_32594)


ราคา
147
การขาย
11.19K
ติดตั้งฟรี