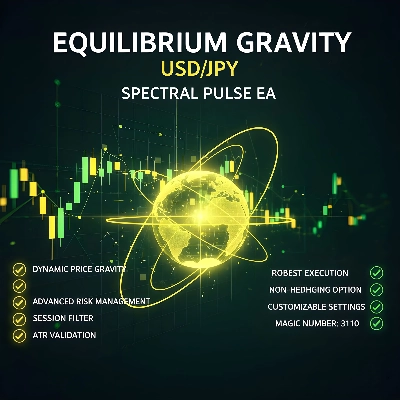
คำอธิบาย
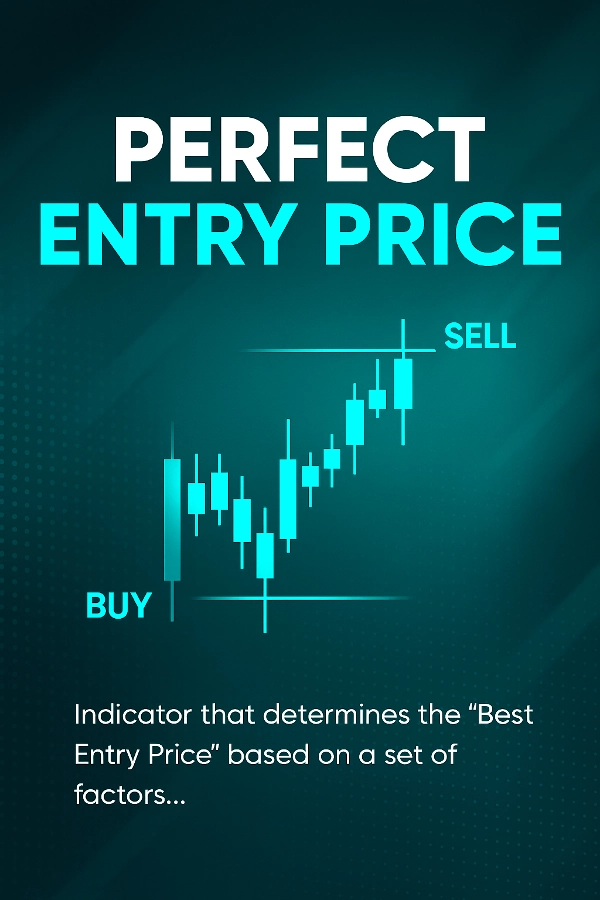
Perfect Entry Price คืออินดิเคเตอร์รุ่นถัดไปที่ออกแบบมาเพื่อช่วยเทรดเดอร์ระบุระดับราคาที่แม่นยำและเชื่อถือได้ที่สุดสำหรับการเข้าตลาด
มันจะสแกนโครงสร้างตลาด, พลวัตปริมาณ และพฤติกรรมราคาโดยอัตโนมัติเพื่อหาพื้นที่ที่มีแนวโน้มจะเกิดการกลับตัวหรือดำเนินต่อไปมากที่สุด
อินดิเคเตอร์นี้เหมาะสำหรับเทรดเดอร์ที่ต้องการเข้าตลาดในช่วงเวลาที่มีความน่าจะเป็นสูงสุดและความเสี่ยงต่ำสุด — ไม่ว่าคุณจะทำการสแคปปิ้ง, เทรดรายวัน หรือเทรดสวิง
วิธีการทำงาน (คำอธิบายแบบง่าย)
อินดิเคเตอร์จะวิเคราะห์ข้อมูลตลาดล่าสุดอย่างต่อเนื่องเพื่อประเมินว่าผู้เทรดสถาบันอาจเข้าหรือมีปฏิกิริยาต่อราคาที่ใด
มันวัดปัจจัยทางเทคนิคและพฤติกรรมหลายอย่างเพื่อสร้าง "ระดับการเข้าที่ดีที่สุด"
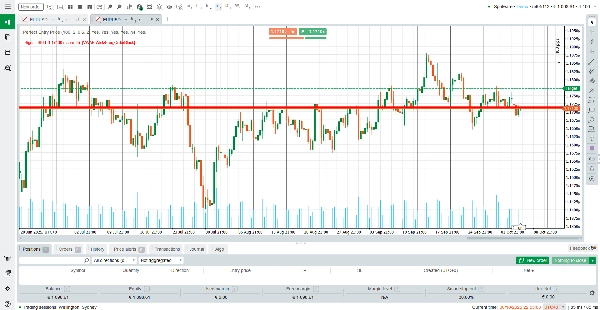
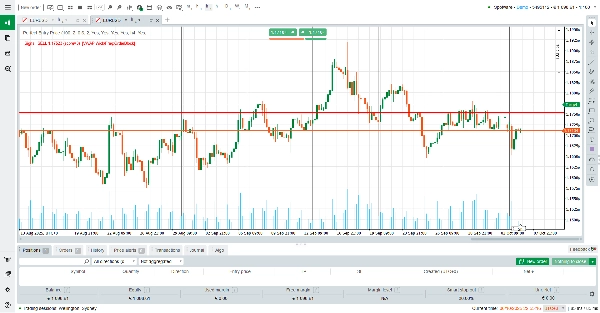
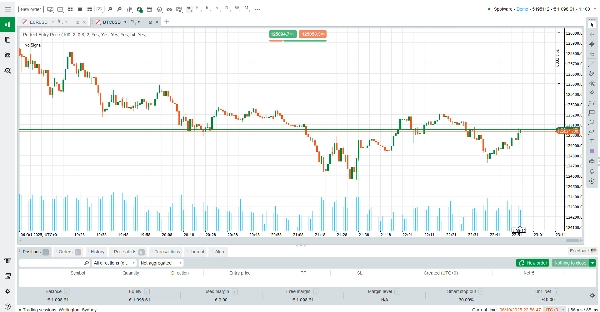
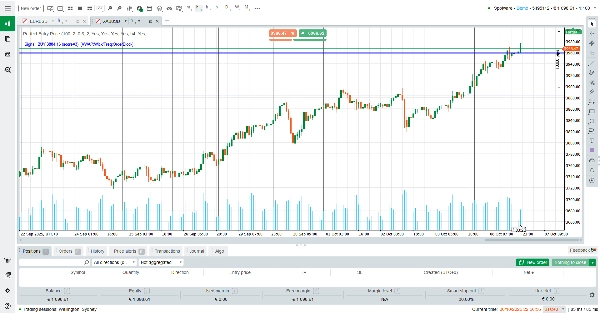
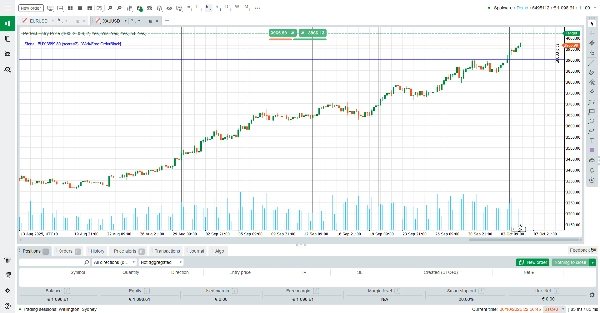
เมื่อพบระดับนั้นแล้ว จะถูกวาดโดยอัตโนมัติเป็นเส้นแนวนอนสีบนกราฟของคุณ:
🔵 เส้นสีน้ำเงิน – แสดงโซนเข้าซื้อที่เป็นไปได้
🔴 เส้นสีแดง – แสดงโซนเข้าขายที่เป็นไปได้
เมื่อมีการตั้งค่าที่ถูกต้อง ป๊อปอัพข้อความจะปรากฏที่มุมบนซ้ายของกราฟแสดงว่า:
พบสัญญาณ — ซื้อ (หรือขาย) ที่ [ราคา] พร้อมคำอธิบายสั้น ๆ ของปัจจัยยืนยันที่ใช้
ถ้าคุณเห็นข้อความ “No Signal” เป็นตัวหนังสือสีดำ หมายความว่าไม่มีจุดเข้าที่แข็งแกร่งในช่วงเวลานั้น
ในกรณีนั้น เพียงเปลี่ยนไปยังช่วงเวลาอื่น (เช่น จาก M5 เป็น M15 หรือ H1) เพื่อรีเฟรชและวิเคราะห์โครงสร้างตลาดใหม่
ตรรกะนี้ปรับตัวได้และคำนวณใหม่อย่างต่อเนื่องแบบเรียลไทม์ — หมายความว่าทุกการเคลื่อนไหวของราคา (tick) จะประเมินสภาพตลาดใหม่เพื่อความแม่นยำสูงสุด
วิธีอ่านอินดิเคเตอร์
รอสัญญาณ — ข้อความ “BUY” หรือ “SELL” จะปรากฏพร้อมเส้นแนวนอน
สังเกตพฤติกรรมราคา — ดูว่าราคาตอบสนองอย่างไรเมื่อเข้าใกล้ระดับที่ทำเครื่องหมายไว้
ใช้การยืนยัน — รวมกับเครื่องมือยืนยันของคุณเอง (เส้นแนวโน้ม, RSI, ปริมาณ ฯลฯ) หากต้องการ
ไม่มีสัญญาณ? — ข้อความสีเหลือง “No Signal” หมายความว่าสภาพยังไม่เหมาะสม; ลองเปลี่ยนช่วงเวลา
เพลิดเพลินกับความชัดเจน — เส้นทั้งหมดจะอัปเดตและจัดการโดยอัตโนมัติ; ไม่ต้องวาดด้วยมือ
คุณสมบัติหลัก
การตรวจจับการเข้าที่ชาญฉลาด — ใช้การประเมินหลายปัจจัยขั้นสูงเพื่อหาจุดเข้าที่มีความน่าจะเป็นสูงสุด
การยืนยันช่วงเวลาที่สูงกว่า — ตรวจสอบการสอดคล้องของแนวโน้มในหลายช่วงเวลาโดยอัตโนมัติสำหรับความแม่นยำที่มากขึ้น
ระดับอัปเดตอัตโนมัติ — ลบเส้นเก่าทั้งหมดและแทนที่โดยอัตโนมัติเพื่อให้กราฟของคุณสะอาด
ตรรกะปรับตัวแบบเรียลไทม์ — คำนวณใหม่อย่างต่อเนื่องตามข้อมูลตลาดล่าสุด ไม่ใช่แค่แท่งเทียนที่ผ่านมา
การแจ้งเตือนที่ชัดเจน — แสดงข้อความแจ้งเตือนบนกราฟโดยตรงเพื่อความรับรู้ทันที
ทำไมต้องเลือก Perfect Entry Price
แตกต่างจากตัวสร้างสัญญาณหรือแนวรับ/แนวต้านทั่วไป Perfect Entry Price มุ่งเน้นที่ระดับที่แม่นยำซึ่งเงินมืออาชีพมีแนวโน้มจะทำการซื้อขายมากที่สุด
มันกรองพื้นที่อ่อนแอออกและเน้นเฉพาะพื้นที่ที่มีการยืนยันหลายครั้ง ทำให้เทรดเดอร์มั่นใจที่จะตัดสินใจอย่างเด็ดขาด
ไม่มีพารามิเตอร์ที่ซับซ้อน — เพียงแค่โหลด, ดูกราฟ และเทรดโอกาสที่ดีที่สุดด้วยความแม่นยำที่ไม่มีใครเทียบ
สรุป
Key features include multi-factor evaluation for smart entry detection, higher-timeframe trend confirmation, automatic updating and removal of outdated levels, and continuous real-time recalculation for precision. The indicator supports various markets including Forex, cryptocurrencies, commodities, indices, and stocks. It is suitable for scalping, day trading, and swing trading styles. Perfect Entry Price focuses on levels where institutional traders are likely active, filtering out weaker signals to assist traders in making informed entry decisions without manual drawing or complex parameter settings.
รีวิวจากลูกค้า
5 | 100 % | |
4 | 0 % | |
3 | 0 % | |
2 | 0 % | |
1 | 0 % |