
Descrizione
🔧 ATR_RR_SignalPanel — Descrizione Tecnica & Dettagliata (IT) 🧠📈
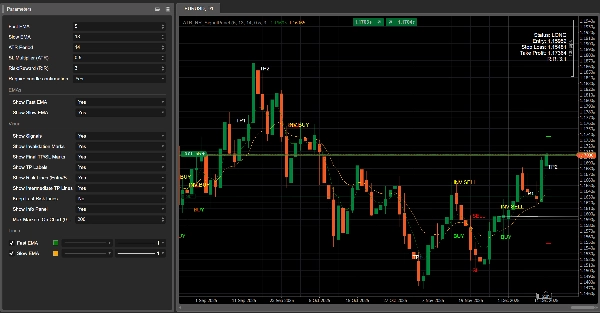
ATR_RR_SignalPanel è un indicatore sovrapposto per cTrader che genera segnali di ingresso per cambi di trend usando un regime Fast EMA vs Slow EMA, quindi costruisce un completo framework di trading virtuale (Ingresso 🏁, Stop Loss 🛑, Take Profit Finale 🎯, Obiettivi Intermedi 🟢) usando dimensionamento del rischio basato su ATR e un configurabile moltiplicatore Rischio:Ricompensa ⚖️.
🧭 Logica Principale (Motore Segnali) 🚦
- L'indicatore calcola:
-
- Fast EMA ⚡ e Slow EMA 🐢 su Close.
- ATR (smussamento Wilder) 🌡️ per la distanza dello stop basata sulla volatilità.
- Un regime di trend è definito come:
-
- Trend rialzista 🟢 quando
Fast EMA > Slow EMA - Trend ribassista 🔴 quando
Fast EMA < Slow EMA
- Trend rialzista 🟢 quando
- Un Cambio di Trend 🔁 si attiva quando lo stato bull/bear differisce dalla barra precedente (equivalente a Pine’s
bullTrend != bullTrend[1]).
🎯 Condizioni di Ingresso (BUY/SELL) 🟩🟥
Quando si verifica un cambio di trend:
- Segnale BUY 🟢 se:
-
- Il trend rialzista è attivo e viene rilevato un cambio di trend
- Conferma candela opzionale ✅: Close > Open (candela rialzista)
- Segnale SELL 🔴 se:
-
- Il trend ribassista è attivo e viene rilevato un cambio di trend
- Conferma candela opzionale ✅: Close < Open (candela ribassista)
🧪 Gestione Posizione Virtuale (Non un cBot) 🧩
Questo indicatore non piazza ordini. Invece simula una “posizione virtuale” interna:
- Su un nuovo segnale BUY/SELL imposta:
-
- Prezzo di Ingresso = close corrente 🏁
- Stop Loss = estremo candela ± ATR × moltiplicatore 🛑
- Take Profit Finale = Ingresso ± (Rischio × RiskReward) 🎯
- Livelli TP intermedi = step a 1R, 2R, … fino a floor(RR)-1 🟢
- Monitora l’azione del prezzo barra per barra:
-
- Se TP finale viene toccato ➜ segna 🎯 e chiude la posizione virtuale ✅
- Se SL viene toccato ➜ segna 🛑 e chiude la posizione virtuale ❌
- I colpi ai TP intermedi sono tracciati una sola volta 🧷
🔁 Logica di Invalidazione (Segnale Opposto Durante Attività) ⚠️
Se arriva un nuovo segnale mentre esiste una posizione virtuale nella direzione opposta:
- L’ingresso precedente viene marcato come INVALIDATO ⚠️ (INV BUY / INV SELL)
- La posizione virtuale precedente viene terminata 🧯
- Viene creata una nuova posizione virtuale nella nuova direzione 🔄
🧼 Multi-istanza Sicura (Più Copie sullo Stesso Grafico) 🧩🧩
Ogni istanza dell’indicatore genera un ID interno unico 🆔, quindi:
- Linee/testi da un’istanza non sovrascriveranno un’altra istanza ✅
- Puoi eseguire diverse configurazioni in parallelo (es. scalping + swing) 🧠📊
🧯 Controlli Anti-Confusione (Limitatore di Marker) 🧹✨
Per mantenere i grafici leggibili, può:
- Limitare il numero di marker di testo disegnati (BUY/SELL/TP/SL/INV/TP1…) 🧾
- Eliminare automaticamente i marker più vecchi quando il limite è superato ♻️
🧷 Opzionale “Mantieni Ultime Linee di Rischio” 🧠📌
Quando abilitato, le ultime linee di Ingresso/SL/TP rimangono visibili anche dopo la chiusura TP/SL:
- Ottimo per la revisione post-trade 🧑🔬
- Ottimo per il journaling 📒✅
⚙️ Parametri — Spiegazione Dettagliata (IT) 🔍📌
📈 Segnale & Core Rischio
⚡ Fast EMA
- Cosa fa 🧠: Imposta il periodo della fast EMA usata per rilevare i cambi di regime.
- Effetto 📊: Valori più bassi = più reattivo ➜ più segnali; più alti = più liscio ➜ meno segnali.
- Range tipici 🎛️: 3–10 per mercati veloci ⚡, 10–20 per setup più calmi 🐢
🐢 Slow EMA
- Cosa fa 🧠: Imposta il periodo della slow EMA usata come baseline del trend.
- Effetto 📊: Slow EMA più alta = filtro più forte ➜ meno trigger di cambio trend.
- Range tipici 🎛️: 13–55 a seconda dello stile 🧭
🌡️ Periodo ATR
- Cosa fa 🧠: Controlla la lunghezza della misurazione della volatilità per l’ATR.
- Effetto 📏: ATR corto reagisce rapidamente (SL più stretto), ATR lungo stabilizza (SL più stabile).
- Range tipici 🎛️: 10–21 è comune ✅
🛑 Moltiplicatore SL (ATR)
- Cosa fa 🧠: Definisce la distanza dello Stop Loss in unità ATR.
- Long 🟢:
SL = Low - ATR * Mult - Short 🔴:
SL = High + ATR * Mult - Effetto 🎯: Moltiplicatore più alto = SL più ampio (meno stop, rischio maggiore); più basso = SL più stretto (più stop).
- Valori tipici 🎛️: 0.3–2.0 a seconda della volatilità 🌪️
⚖️ Rischio:Ricompensa (R:R)
- Cosa fa 🧠: Moltiplica la distanza del “rischio” per calcolare il TP finale.
- Formula 📌:
-
- Rischio = |Ingresso − SL|
- TP finale = Ingresso ± Rischio × RR 🎯
- TP intermedi 🟢: TP1 a 1R, TP2 a 2R, … fino a
floor(RR)-1 - Esempio 🧪: RR=3 ➜ TP1 (1R), TP2 (2R), TP Finale (3R) 🎯🎯🎯
✅ Richiedi conferma candela
- Cosa fa 🧠: Aggiunge la validazione della direzione della candela sulla barra del segnale.
- BUY 🟢: richiede Close > Open
- SELL 🔴: richiede Close < Open
- Effetto 🧽: Filtra i falsi segnali, riduce il rumore, può entrare più tardi ⏳
📌 Visualizzazione EMAs
👁️ Mostra Fast EMA
- Cosa fa 🧠: Mostra/nasconde la linea della fast EMA.
- Uso 💡: Nascondi se vuoi un grafico pulito 🧼
👁️ Mostra Slow EMA
- Cosa fa 🧠: Mostra/nasconde la linea della slow EMA.
- Uso 💡: Mantieni visibile per il contesto del trend 🧭
🎛️ Controlli Visivi (Gestione Confusione) 🧹✨
🚦 Mostra Segnali
- Cosa fa 🧠: Mostra/nasconde i marker BUY/SELL.
- Include 🧷: marker BUY 🟢 / SELL 🔴 (solo)
- Suggerimento 💡: Disabilita per la modalità “solo linee” 📏
🏷️ Mostra Etichette TP
- Cosa fa 🧠: Mostra/nasconde etichette come TP1, TP2…
- Effetto 🧼: Disattivando si rimuove molto rumore testuale su TF più alti 📉
- Nota 🧷: Le etichette appaiono solo una volta per ogni colpo TP ✅
⚠️ Mostra Marchi di Invalidazione
- Cosa fa 🧠: Mostra/nasconde marker INV BUY / INV SELL.
- Uso 🧠: Utile quando vuoi studiare inversioni di segnale 🔁
🎯🛑 Mostra Marchi TP/SL Finali
- Cosa fa 🧠: Mostra/nasconde marker TP e SL finali.
- Uso 📒: Ottimo per rivedere la distribuzione dei risultati 🎲
📏 Mostra Linee di Rischio (Ingresso/SL/TP)
- Cosa fa 🧠: Disegna linee di Ingresso 🏁, SL 🛑, TP Finale 🎯 sul grafico.
- Effetto 📌: Visualizza istantaneamente la struttura del trade virtuale 🧠
🟢 Mostra Linee TP Intermedie
- Cosa fa 🧠: Disegna linee tratteggiate per i livelli TP1/TP2/…
- Suggerimento 🧼: Disabilita se il grafico diventa troppo “spaghetti verde” 🍝🟢
📌 Mantieni Ultime Linee di Rischio
- Cosa fa 🧠: Mantiene visibili le ultime linee di Ingresso/SL/TP dopo l’uscita virtuale (TP/SL).
- Perché è utile 📒: Perfetto per journaling & analisi post-trade 🧑🔬✅
🧾 Max Marker sul Grafico (0=illimitato)
- Cosa fa 🧠: Limita quanti oggetti di testo l’indicatore lascia sul grafico.
- Come funziona ♻️: Quando il limite è superato, i marker più vecchi vengono rimossi automaticamente.
- Consigliato 🎛️: 80–200 a seconda del timeframe e della profondità della storia 🕰️
🧾 Mostra Pannello Informazioni
- Cosa fa 🧠: Visualizza un pannello di stato compatto sul grafico.
- Mostra 📋: Stato (LONG/SHORT/Nessuna Posizione), Ingresso, SL, TP, RR calcolato.
Riepilogo
The indicator simulates virtual trades by setting entry price, stop loss, and take profit levels using Average True Range (ATR) for volatility-based risk sizing combined with a configurable risk-to-reward multiplier. It tracks intermediate take profit levels and monitors price action bar-by-bar to mark virtual trade outcomes without placing actual orders.
Key features include optional candle confirmation for signals, multi-instance support to run multiple configurations on the same chart, and visual clutter controls such as limiting markers and toggling display of EMAs, signals, and risk lines. An info panel provides a compact status overview of virtual positions. Parameters allow customization of EMA periods, ATR period, stop loss multiplier, and risk-reward ratio to adapt to different trading styles and market conditions.
Supported markets include Forex, indices, commodities, stocks, and cryptocurrencies, with symbols like GBPUSD, EURUSD, XAUUSD, NAS100, and BTCUSD among the tagged assets.
Recensioni dei clienti
5 | 100 % | |
4 | 0 % | |
3 | 0 % | |
2 | 0 % | |
1 | 0 % |


