
Supertrend Indicator v1.1
مؤشر
32 عمليات الشراء
الإصدار 1.2، Feb 2026
Windows, Mac
4.3
التقييمات: 3
الوصف
عرض توضيحي:
مؤشر السوبرتريند – أداة أساسية للمتداولين تجعل من السهل ركوب اتجاهات السوق واتخاذ قرارات استثمارية أذكى! هذا المؤشر البديهي وذو المستوى الاحترافي مصمم لتقديم إشارات شراء وبيع واضحة تمامًا، سواء كنت مبتدئًا أو مستثمرًا ذا خبرة.
لماذا تختار مؤشر السوبرتريند؟
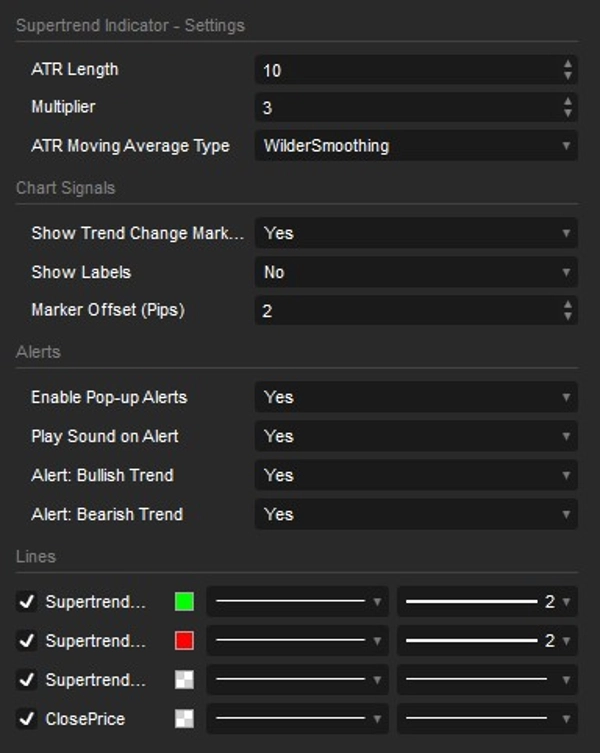
- دقة معيار الصناعة: يتميز الآن بأنواع المتوسط المتحرك ATR القابلة للتخصيص (بما في ذلك التنعيم الخاص بويلدر). يحسب ويتفاعل تمامًا مثل أشهر إصدارات السوبرتريند المميزة الموجودة على أفضل منصات الرسم البياني مثل TradingView!
- 100% بدون إعادة رسم: مصمم بآلية ذاكرة اتجاه قوية. بمجرد تغير الاتجاه وظهور إشارة، تبقى هناك. لا إعادة رسم، لا سهام تختفي، ولا أخطاء في إعادة الحساب عند التمرير عبر تاريخ الرسم البياني.
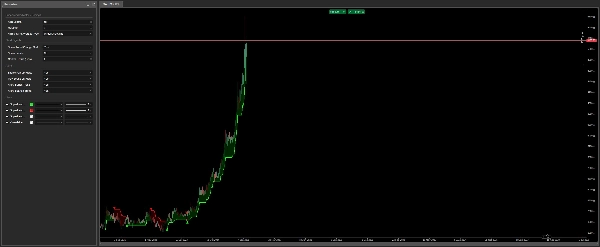
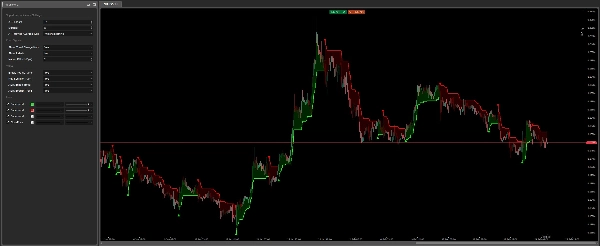
- البساطة والفعالية: يقوم المؤشر تلقائيًا برسم خط السوبرتريند الذي يتحول إلى اللون الأخضر عندما يرتفع السوق (إشارة شراء) وإلى الأحمر عندما ينخفض (إشارة بيع). ستعرف دائمًا بالضبط اتجاه الاتجاه.
- إشعارات ذكية في الوقت الحقيقي: لا تفوت أي فرصة تداول! يتميز المؤشر بنظام تنبيه مطور يستخدم نوافذ منبثقة أصلية في cTrader وتأثيرات صوتية مدمجة. بالإضافة إلى ذلك، مع حماية مدمجة من الرسائل المزعجة، يتم تنبيهك مرة واحدة فقط عند حدوث إشارة في الوقت الحقيقي—لا ضجيج صوتي مزعج عند تحميل أو إعادة تحميل الرسوم البيانية.
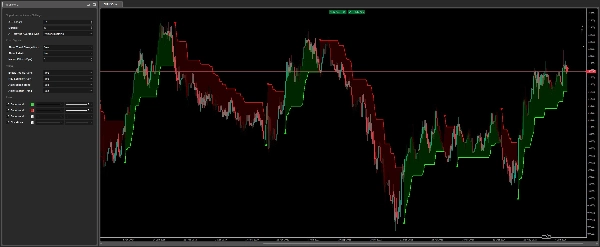
- إشارات بصرية محسنة وملء سحابي: عند كل تغيير رئيسي في الاتجاه، سترى سهامًا لافتة للنظر وتسميات نصية اختيارية "صعودي"/"هبوطي". يساعد ملء سحابي ديناميكي خفيف بين خط السوبرتريند والسعر على فهم زخم السوق بسهولة بنظرة واحدة.
- قابلية تخصيص كاملة ودقة عالية: قم بضبط الإعدادات الأساسية بسهولة مثل طول ATR والمضاعف. يمكنك أيضًا التحكم بدقة في مسافة الأسهم والتسميات باستخدام تعويضات ديناميكية تعتمد على النقاط، مما يضمن رؤية مثالية وغير مزدحمة على أي أصل.
مؤشر السوبرتريند مثالي لأي شخص يرغب في تبسيط تحليل السوق – من المتداولين المبتدئين الذين يبحثون عن طريقة سهلة لرصد الاتجاهات، إلى المحترفين المخضرمين الذين يريدون إشارات دقيقة جدًا وغير معادة الرسم لاستراتيجياتهم. يعمل بشكل مثالي على أي سوق – الفوركس، الأسهم، المؤشرات، العملات المشفرة – وعبر جميع الأطر الزمنية.
الملخص
ملخص الذكاء الاصطناعي
The Supertrend Indicator v1.1 is a professional-grade trading tool designed to identify market trends and provide clear buy and sell signals. It features customizable ATR moving average types, including Wilder's smoothing, ensuring accuracy comparable to leading platforms. The indicator is 100% non-repainting, maintaining stable signals without recalculation errors or disappearing markers. It visually represents trends with a line that turns green during upward movements and red during downward trends, complemented by arrows, optional "Bullish"/"Bearish" labels, and a dynamic cloud fill to highlight market momentum. Real-time alerts use native cTrader pop-ups and sound effects with built-in spam protection, notifying users once per signal. Users can adjust key parameters such as ATR length, multiplier, and visual offsets for precise, uncluttered display across all asset types. The Supertrend Indicator supports multiple markets including Forex, Stocks, Indices, and Cryptocurrencies, and is suitable for all timeframes. It is designed for traders of all experience levels seeking a reliable, easy-to-interpret trend analysis tool.
ملف تعريف المؤشر
تقييمات العملاء
4.3
التقييمات: 3
5 | 33 % | |
4 | 67 % | |
3 | 0 % | |
2 | 0 % | |
1 | 0 % |
تقييمات العملاء
November 4, 2025
Smooth and steady - Supertrend v1.1 keeps you riding the trend with confidence. Clear color switches show when momentum flips, helping you enter early and exit smart. Fast, reliable, and a classic trend tool that belongs in every trader’s arsenal. Pairs perfectly with momentum filters or ATR-based setups for precision entries!
August 6, 2025
مناقشة
الأسئلة الشائعة
Signal
Indices
Commodities
GBPUSD
RSI
Bollinger
Fibonacci
Scalping
AI
XAUUSD
NAS100
MACD
BTCUSD
Forex
Breakout
EURUSD
NZDUSD
Martingale
Prop
ZigZag
Supertrend
Fair Value Gap
SMC
Crypto
Grid
Stocks
ATR
USDJPY
VWAP
يتم توفير المنتجات المتاحة من خلال cTrader Store، بما في ذلك روبوتات التداول والمؤشرات والإضافات، من قبل مطوري الطرف الثالث وإتاحتها لأغراض الوصول المعلوماتي والفني فقط. cTrader Store ليس وسيطًا ولا يقدم نصائح استثمارية أو توصيات شخصية أو أي ضمان للأداء المستقبلي.


![شعار "High-Low Divergence [Iridio Capital]"](https://cdn.ctrader.com/image/webp/443c4661-7abb-40f1-842f-4b6ec560649b_40914)


السعر
89
المبيعات
149
التثبيتات المجانية