present
سجل واحصل على خصم 50 دولارًا على مشترياتك الأولى
Trading product for RSI Indicator مؤشر SMA RSI, image 1
RSI Indicator
مؤشر
الإصدار 1.0، May 2026
Windows, Mac
Trading product for RSI Indicator مؤشر SMA RSI, image 2
Trading product for RSI Indicator مؤشر SMA RSI, image 3
100
المبيعات
197
التثبيتات المجانية

الوصف

عرض تقديمي:


مؤشر RSI - هذا المؤشر هو تنفيذ متقدم ونظيف لمذبذب مؤشر القوة النسبية الكلاسيكي (RSI) لمنصة cTrader. تم تطويره وفقًا صارمًا للمؤشر الأصلي من TradingView (استنادًا إلى مواصفاتهم الرسمية).

بفضل استخدام نموذج التنعيم RMA (المتوسط المتحرك الجاري)، يتصرف هذا المؤشر ويرسم تمامًا مثل نظيره في TradingView. كما ضمنا تجربة بصرية متطابقة تمامًا.

الميزات والوظائف الرئيسية:

  • توافق 100% مع TradingView: يستخدم الخوارزمية نفس منطق الحساب بالضبط مثل مؤشر TV الأصلي (استنادًا إلى صيغة RMA).
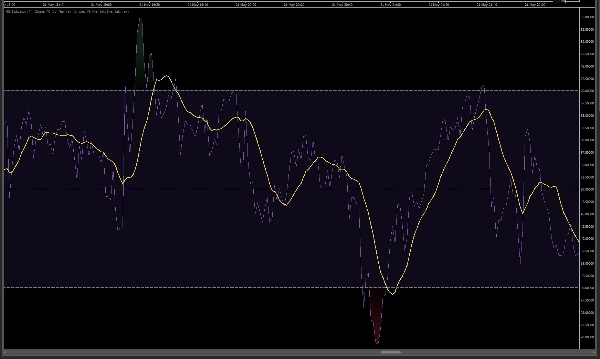
  • تصميم بصري مذهل (تدرجات ديناميكية): يتم تطبيق نظام تظليل لوني مبتكر مكون من 30 مستوى. كلما ارتفع RSI إلى منطقة الشراء المفرط (فوق 70)، يصبح الخلفية الحمراء أكثر كثافة. وكلما انخفض إلى منطقة البيع المفرط (أقل من 30)، يصبح اللون الأخضر أعمق. النطاق الأوسط يحتفظ بالنغمة الأرجوانية الكلاسيكية.
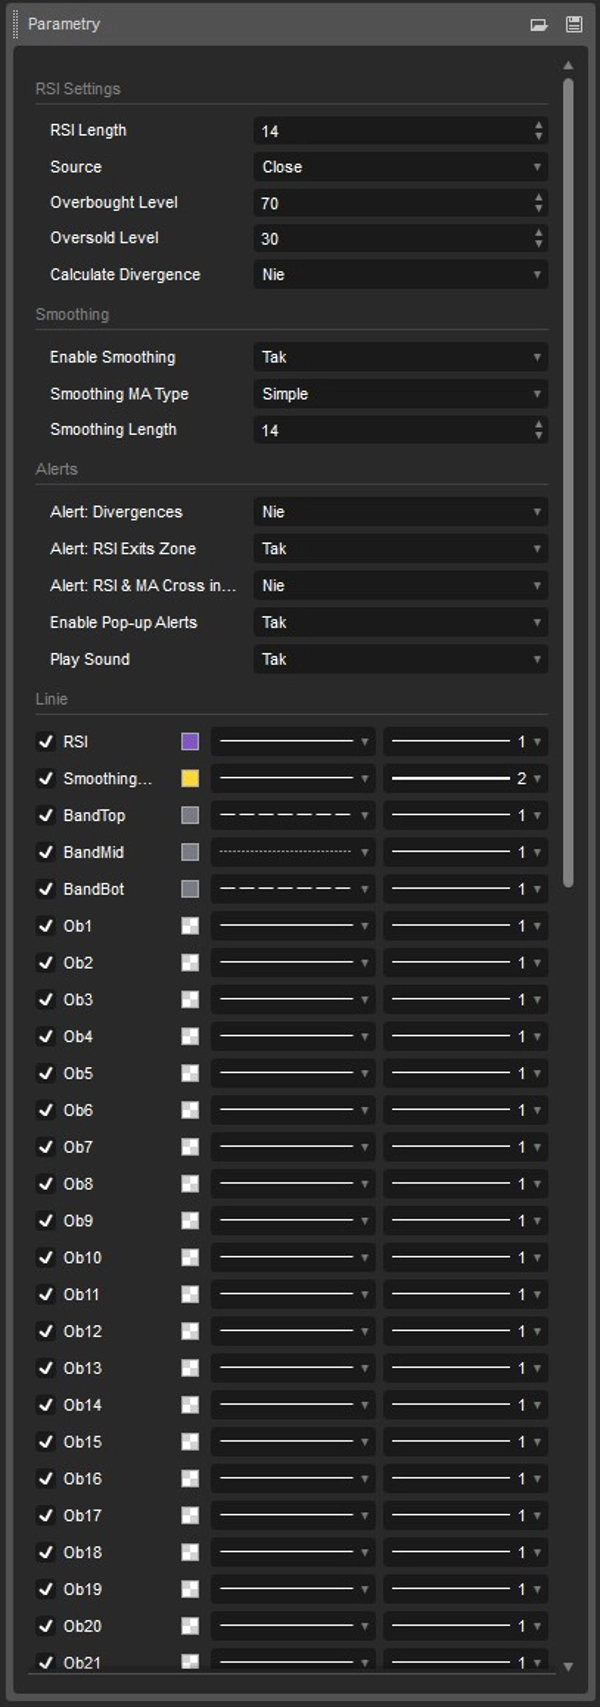
  • المتوسط المتحرك المدمج (MA): كما في أحدث إصدارات TV، يمكنك تفعيل خط المتوسط المتحرك (مثل SMA) الذي ينعم خط RSI ويساعد في تحديد الاتجاهات داخل المذبذب نفسه.
  • الكشف التلقائي عن التباعد: يمكن للمؤشر مسح الرسم البياني تلقائيًا للبحث عن التباعدات العادية. عند اكتشاف عدم تطابق بين السعر وقوة اتجاه RSI، يرسم خطوط وعلامات (صعودي: أخضر، هبوطي: أحمر) مباشرة في نافذة المؤشر.
  • نظام تنبيه قوي (نافذة منبثقة وصوت): ابق على اطلاع دائم في جميع الأوقات. سيقوم المؤشر بإعلامك عندما:
    • يخرج RSI من مناطق الشراء/البيع المفرط (مولدًا إشارات شراء/بيع كلاسيكية)،
    • يتقاطع خط RSI مع خط MA عميقًا داخل هذه المناطق،
    • يتم اكتشاف تباعد جديد.

لمن هذا المؤشر؟

إذا كنت معتادًا على تحليل RSI على TradingView، وتبحث عن إشارات متطابقة تمامًا في cTrader، وتقدر التصميم النظيف والجذاب بصريًا (دون تعديل الألوان يدويًا)، فهذا المؤشر هو الحل المثالي.

سهل الاستخدام، دقيق في الأداء، ومخلص للأصل!

cGuru

الملخص

ملخص الذكاء الاصطناعي
The RSI Indicator is a cTrader implementation of the classic Relative Strength Index oscillator, designed to replicate TradingView’s original indicator using the Running Moving Average (RMA) smoothing method. It provides 100% calculation compatibility with TradingView, ensuring identical signal behavior and visual presentation. Key features include a dynamic 30-level gradient color scheme that visually distinguishes overbought (red) and oversold (green) zones, with a neutral purple mid-range. The indicator supports an optional moving average line (e.g., SMA) to smooth the RSI curve and highlight trends within the oscillator. It also offers automatic detection of regular divergences between price and RSI trends, marking bullish and bearish divergences directly on the chart. A built-in alert system notifies users via pop-up and sound when the RSI exits overbought/oversold zones, crosses the moving average within these zones, or when new divergences are detected. This indicator is suitable for traders familiar with TradingView’s RSI who seek an accurate, visually clear, and feature-rich RSI tool within the cTrader platform.
ملف تعريف المؤشر
فئة المؤشر
الدعم والمقاومة
نوع المخرجات
التصور
متطلبات البيانات
بيانات التيك
الإشارات المدعومة
الانعكاس
التباين

تقييمات العملاء

0.0
التقييمات: 0
تقييمات العملاء
لا توجد تقييمات لهذا المنتج حتى الآن. هل جرَّبته بالفعل؟ كن أول من يخبر الآخرين!

مناقشة

الأسئلة الشائعة

SMA
RSI
Moving Average
يتم توفير المنتجات المتاحة من خلال cTrader Store، بما في ذلك روبوتات التداول والمؤشرات والإضافات، من قبل مطوري الطرف الثالث وإتاحتها لأغراض الوصول المعلوماتي والفني فقط. cTrader Store ليس وسيطًا ولا يقدم نصائح استثمارية أو توصيات شخصية أو أي ضمان للأداء المستقبلي.


المزيد من هذا المؤلف

مؤشر
AI
ATR
+27
Trend Is Your Friend cBot - INDICATOR - Professional Grid, Pyramid, Swing & Scalp Trading Indicator
مؤشر
AI
ATR
+27
Supertrend Indicator
مؤشر
AI
ATR
+27
Nadaraya-Watson Envelope Indicator
مؤشر
AI
ATR
+27
Market Cipher B
مؤشر
AI
ATR
+27
Supertrend Indicator
cBot
AI
ATR
+27
RSI Simple Grid cBot - grid trading strategy with RSI (Relative Strength Index) signals
26.8%
العائد على الاستثمار
4.41
عامل الربح
مؤشر
AI
ATR
+26
MacD Custom Indicator-Multiple Time Frame
مؤشر
AI
ATR
+19
Market Cipher A
cBot
AI
ATR
+27
SmartHedge cBot - Your Trading Companion
1.26
عامل الربح
مؤشر
EMA
SMA
+3
MACD indicator modeled after TradingView, featuring a 4-color momentum histogram, sound/pop-up crossover alerts.
cBot
ATR
RSI
+5
Trend is your friend cBot - Professional Grid, Pyramid, Swing & Scalp Trading System
28%
العائد على الاستثمار
5.27
عامل الربح

قد يعجبك أيضًا

مؤشر
Breakout
Institutional Flow Radar scans the chart for abnormal volume events and classifies them into two groups: Capital &Public
مؤشر
ADX
ATR
+5
Signal Quality Score - 0-100 filter combining RSI, Volume, ATR, Trend Strength & Alignment. Works on ANY chart type.
مؤشر
SMC
BTCUSD
+9
Detects CHoCH breakouts, draws interest zones & auto Fibo. Built for Smart Money & Price Action Engulfing confirmation
مؤشر
Channel
Imbalance
+2
Adaptive volatility channel based on moving average and standard deviation (σ).
مؤشر
Volume
Custom range volume profile between two draggable anchors. Auto source timeframe, Total/Up-Down/Delta, POC, Value Area.
مؤشر
Pin Bar
Inside Bar
+2
Advanced candlestick pattern recognition with structural quality scoring, alerts and adaptive chart visuals.
مؤشر
MACD
Prop
+14
Enhance MACD Histogram! Visualize bull and bear price changes with vibrant colors for clearer, more insightful trading.
مؤشر
MACD
Forex
+5
🚀 MACD Pro Trader – Advanced MACD with buy/sell signals, custom MAs & color-coded histograms for smarter trading! 📈🔥
مؤشر
MACD
Prop
+14
Customize the MACD! Choose colors, get real-time tick updates, and see crossover points for enhanced trading precision.
مؤشر
Forex
BTCUSD
+10
Enhance trading with TSI! Use the True Strength Index for clear insights into market momentum and trend strength.
مؤشر
Block Liquidity,indicator.Block Order, Liquids Stops, Signal Sentiment,signal correctio.
مؤشر
ATR
Forex
+6
It combines swing (pivot-based) market structure detection with Gann Fan geometry and Fibonacci retracement/extension
شعار "Osvolt Trend Hunter"
الأعلى تقييمًا
4.6
(5)
$19
/
$25
مؤشر
ATR
RSI
+16
Multi-timeframe trend indicator using EMA, MACD & ADX to confirm high-probability buy and sell bias.
مؤشر
BOS
Fibonacci
+4
Automatically draws major trading sessions, killzones, and SMC daily liquidity targets directly on your cTrader charts.
مؤشر
ATR
BOS
+5
Full ICT/SMC 4-step setup checker that alerts a long or short setup.
مؤشر
BB Breakout Oscillator with alerts! Spot trend reversals using Bollinger Bands. Bullish/Bearish crossovers Alerts.
مؤشر
RSI
Forex
+6
What Constance Brown did with the RSI was to input a momentum calculation within the RSI itself. This the Composite RSI.
مؤشر
The Weekly Daily Levels indicator shows the OHLC, and mid-point prices for the previous day and week.

السعر

100
المبيعات
197
التثبيتات المجانية