

Opis
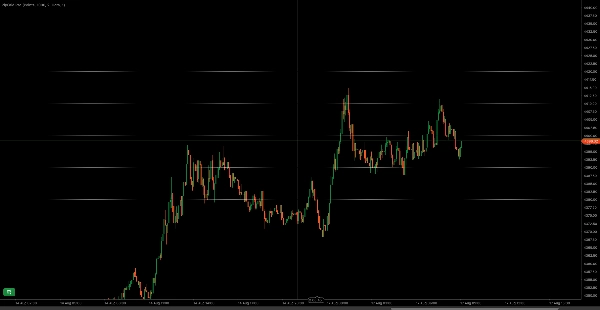
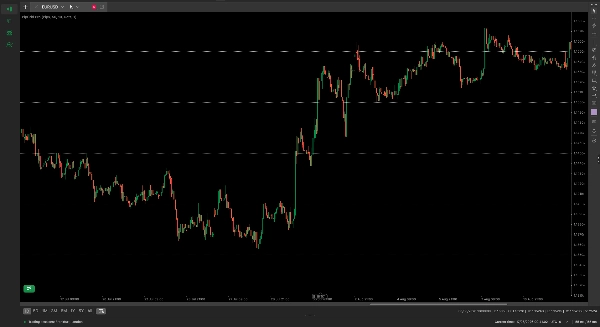
PipGrid Pro automatycznie rysuje czyste, nieinwazyjne poziome poziomy cenowe skalibrowane do Twojej dokładnej strategii handlowej bez zaśmiecania wykresów.
Instytucjonalny przepływ zleceń, ustawienia stopów i cele take-profit konsekwentnie skupiają się wokół psychologicznych pełnych liczb i dużych wartości. Podczas gdy ogólne skrypty zawodzą przy przełączaniu między instrumentami, często rysując linie tysiące pipsów od złota lub kryptowalut, PipGrid Pro natywnie odczytuje specyfikacje ticków i pipsów brokera, aby dostarczyć matematycznie dokładne odstępy poziomów na dowolnym symbolu.
Kluczowe funkcje
- Uniwersalna kalibracja symbolu: Przełączaj się bez wysiłku między Pipsami, Punktami brokera i Jednostkami cenowymi dla dokładnego skalowania na Forex, metalach (XAUUSD), indeksach i kryptowalutach.
- Bezpieczna przestrzeń nazw obiektów: Rysuje wyłącznie pod izolowanym identyfikatorem RNL_. Nigdy nie nadpisze, nie zmodyfikuje ani nie usunie Twoich ręcznych rysunków na wykresie, zniesień Fibonacciego ani wskaźników firm trzecich.
- Dynamiczne śledzenie zakresu: Automatycznie centruje i aktualizuje widoczne okno siatki wraz z ruchem ceny rynkowej.
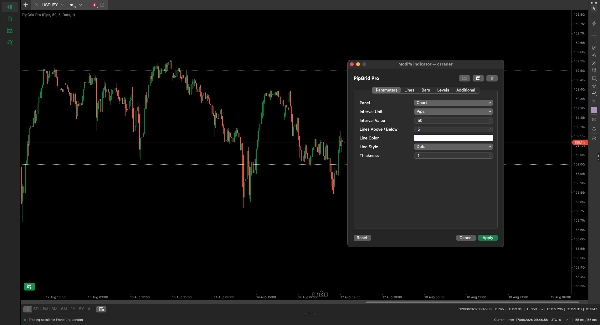
- Pełna wizualna personalizacja: Dostosuj kolory linii, style (ciągłe, kropki, linie, linie i kropki) oraz grubość, aby dopasować do dowolnego ciemnego lub jasnego motywu wykresu.
- Lekka realizacja: Brak opóźnień wydajności; obliczenia wykonują się wyłącznie przy sprawdzaniu granic żywego słupka.
Ustawienia parametrów
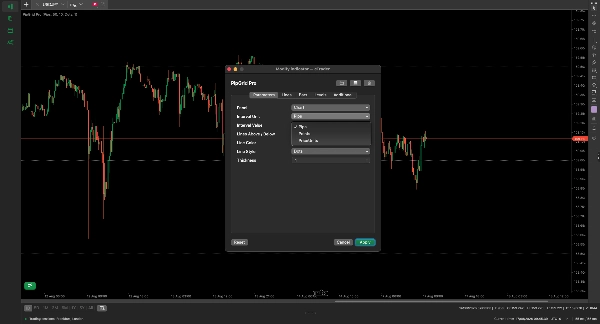
- Jednostka interwału (domyślnie: Pipsy) — Wybierz tryb obliczeń między Pipsami, Punktami lub Jednostkami cenowymi dla dokładnej kalibracji aktywów.
- Wartość interwału (domyślnie: 10.0) — Dokładna odległość kroku między każdą poziomą linią siatki.
- Linie powyżej / poniżej (domyślnie: 20) — Całkowita liczba poziomów siatki narysowanych powyżej i poniżej aktualnej ceny rynkowej.
- Kolor linii (domyślnie: szary) — Wizualny kolor rysowanych linii siatki.
- Styl linii (domyślnie: kropki) — Wzór wizualny linii (ciągłe, kropki, linie, linie i kropki).
- Grubość (domyślnie: 1) — Grubość kreski poziomych linii (wartości od 1 do 5).
Zalecane konfiguracje aktywów
- Forex (EURUSD, GBPUSD): Ustaw jednostkę na Pipsy z interwałem 50 lub 100 dla instytucjonalnych pełnych wartości.
- Złoto (XAUUSD): Ustaw jednostkę na Pipsy z interwałem 10 lub 50 dla czystych uchwytów cenowych $1,00 i $5,00.
- Indeksy (US30, NAS100): Ustaw jednostkę na Punkty z interwałem 100 lub 500 dla kluczowych poziomów kamieni milowych indeksu.
- Krypto (BTCUSD, ETHUSD): Ustaw jednostkę na PriceUnits z interwałem 1000 lub 5000 dla głównych barier psychologicznych.
Podsumowanie
AI summary
PipGrid Pro is a technical indicator designed to plot horizontal price levels aligned with psychological round numbers across multiple markets including Forex, Gold (XAUUSD), Indices, and Cryptocurrencies. It automatically calibrates grid spacing by reading broker-specific tick and pip values, ensuring accurate and mathematically consistent level placement on any symbol. The indicator supports toggling between pips, broker points, and price units for precise scaling.
Key functionalities include dynamic range tracking that recenters the grid as price moves, a safe object namespace that prevents interference with manual drawings or other indicators, and full visual customization options for line color, style, and thickness. PipGrid Pro operates efficiently with zero performance lag by executing calculations only on live bar boundaries.
Users can configure parameters such as interval unit and value, number of lines above and below the current price, and visual styles. Recommended settings are provided for different asset classes to highlight institutional order flow clusters and key support/resistance levels. This tool is intended for traders seeking clean, non-intrusive visualization of key price levels that reflect market psychology and institutional activity.
Key functionalities include dynamic range tracking that recenters the grid as price moves, a safe object namespace that prevents interference with manual drawings or other indicators, and full visual customization options for line color, style, and thickness. PipGrid Pro operates efficiently with zero performance lag by executing calculations only on live bar boundaries.
Users can configure parameters such as interval unit and value, number of lines above and below the current price, and visual styles. Recommended settings are provided for different asset classes to highlight institutional order flow clusters and key support/resistance levels. This tool is intended for traders seeking clean, non-intrusive visualization of key price levels that reflect market psychology and institutional activity.
Profil wskaźnika
Kategoria wskaźnika
Wsparcie i opór
Typ wyjścia
Wizualizacja
Wymagania dotyczące danych
Tylko słupki
Dane tickowe
Opinie klientów
0.0
Opinie: 0
Opinie klientów
Ten produkt nie ma jeszcze opinii. Wypróbowałeś(-aś) go już? Bądź pierwszy(-a) i powiedz o tym innym!
Dyskusja
Częste pytania
Key Levels
Support & Resistance
Produkty dostępne za pośrednictwem cTrader Store, w tym boty handlowe, wskaźniki i wtyczki, dostarczane są przez deweloperów zewnętrznych i udostępniane wyłącznie w celach informacyjnych oraz w celu zapewnienia dostępu technicznego. cTrader Store nie jest brokerem i nie zapewnia doradztwa inwestycyjnego, nie udziela spersonalizowanych rekomendacji ani nie gwarantuje przyszłych wyników.
Więcej od tego autora

















Cena
Od 10/12/2024
1
Sprzedaż