
UTBotAlerts
Wskaźnik
1 zakupy
Wersja 1.0, Jun 2026
Windows, Mac
5.0
Opinie: 1
Opis
The UT Bot to popularny, wysoce konfigurowalny wskaźnik analizy technicznej służący do identyfikacji potencjalnych odwróceń trendu i zmian momentum. Został zaprojektowany, aby uprościć decyzje handlowe poprzez wyświetlanie wyraźnych sygnałów wejścia i wyjścia bezpośrednio na wykresie cenowym.
Kluczowe cechy i elementy
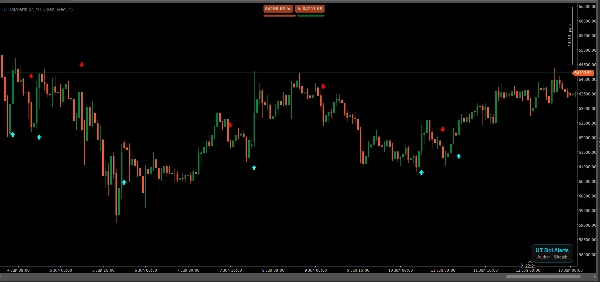
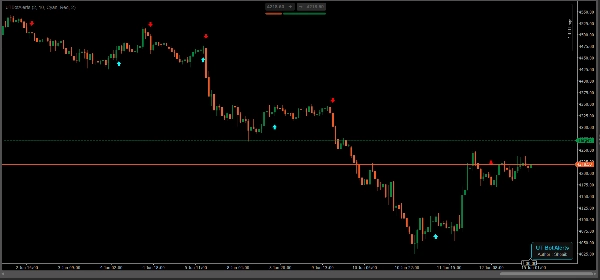
- Sygnały kupna i sprzedaży: Wskaźnik wyświetla zielone strzałki "BUY" (w górę) oraz czerwone strzałki "SELL" (w dół), aby podkreślić potencjalne zmiany trendu. Jak widać na wykresie, sygnał sprzedaży pojawia się na początku spadku rynku, podczas gdy sygnał kupna uruchamia się wraz ze wzrostem momentum.
- Śledzenie trendu: Pomaga traderom wizualnie rozróżnić trend spadkowy (bearish price action poruszający się poniżej linii bazowej) oraz trend wzrostowy (bullish price action wspinający się w górę).
- Integracja z wykresami świecowymi: Sygnały nakładają się płynnie na standardowe wykresy świecowe, co ułatwia zobaczenie dokładnych poziomów cen, przy których bot się uruchamia.
- Czułość oparta na zmienności: UT Bot zazwyczaj opiera się na połączeniu Average True Range (ATR) oraz mechanizmu trailing stop, co pozwala traderom dostosować jego czułość, aby odfiltrować szumy rynkowe lub uchwycić długoterminowe trendy.
Podsumowanie
Podsumowanie AI
UTBotAlerts is a technical analysis indicator designed to identify potential trend reversals and momentum shifts in financial markets. It visually signals buy and sell opportunities by plotting green "BUY" arrows and red "SELL" arrows directly on candlestick price charts, aiding traders in recognizing entry and exit points. The indicator distinguishes between uptrends and downtrends by tracking price action relative to a baseline, helping users interpret market direction clearly. UTBotAlerts incorporates volatility-based sensitivity adjustments using the Average True Range (ATR) combined with a trailing stop mechanism, allowing customization to filter market noise or capture longer-term trends. This indicator supports trend analysis and overlays seamlessly on standard price charts, enhancing decision-making through clear, actionable signals.
Profil wskaźnika
Kategoria wskaźnika
Trend
Typ wyjścia
Sygnały
Wymagania dotyczące danych
Tylko słupki
Obsługiwane sygnały
Siła trendu
Opinie klientów
5.0
Opinie: 1
5 | 100 % | |
4 | 0 % | |
3 | 0 % | |
2 | 0 % | |
1 | 0 % |
Opinie klientów
June 29, 2026
UT Bot Alerts is a lightweight and stable implementation of the classic ATR-based trend reversal indicator. It provides clean BUY/SELL signals, adapts well to changing volatility conditions and works consistently across Forex and Gold markets. Its simplicity and reliability make it particularly useful as a trend filter or confirmation tool.
Dyskusja
Częste pytania
Supertrend
Volume
ATR
Produkty dostępne za pośrednictwem cTrader Store, w tym boty handlowe, wskaźniki i wtyczki, dostarczane są przez deweloperów zewnętrznych i udostępniane wyłącznie w celach informacyjnych oraz w celu zapewnienia dostępu technicznego. cTrader Store nie jest brokerem i nie zapewnia doradztwa inwestycyjnego, nie udziela spersonalizowanych rekomendacji ani nie gwarantuje przyszłych wyników.


Cena
Od 04/09/2025
1
Sprzedaż