
MACDVolume
Wskaźnik
19 zakupy
Wersja 1.0, Dec 2024
Windows, Mac
5.0
Opinie: 3

Opis
Zaawansowany wskaźnik MACD z dynamiczną zmianą koloru i wolumenem
Opis: Nasz zaawansowany wskaźnik MACD to nie tylko prosty histogram. Ten wskaźnik został zaprojektowany, aby zapewnić wyraźny i dynamiczny obraz trendów rynkowych, z unikalnymi funkcjami, które czynią go niezbędnym dla każdego poważnego tradera.
Kluczowe cechy:
- Dynamiczna zmiana koloru:
-
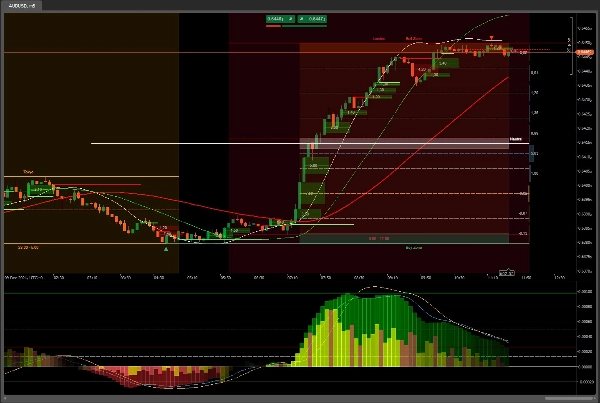
- Pozytywne: Histogram zmienia kolor z zielonego na biały wraz ze wzrostem wartości, zapewniając wyraźną wizualizację trendów wzrostowych.
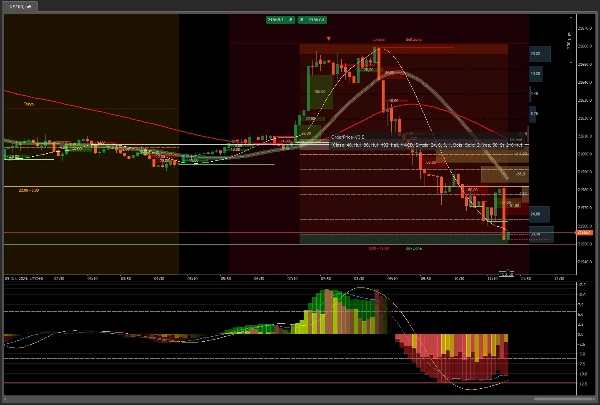
- Negatywne: Histogram zmienia kolor z czerwonego na biały wraz ze spadkiem wartości, podkreślając trendy spadkowe.
- Wskaźnik wolumenu:
-
- Pozytywny wolumen: Reprezentowany przez zielone słupki, wskazujące na wzrost wolumenu obrotu.
- Negatywny wolumen: Reprezentowany przez czerwone słupki, wskazujące na spadek wolumenu obrotu.
- Wyraźna wizualizacja: Połączenie kolorów w słupkach wolumenu (zielony, żółty, brązowy, czerwony) zapewnia jasny obraz aktywności kupna i sprzedaży na rynku.
- Automatyczne powiększanie:
-
- Utrzymuje wskaźnik wyśrodkowany i automatycznie dostosowany do optymalnego widoku, bez potrzeby ciągłych ręcznych korekt.
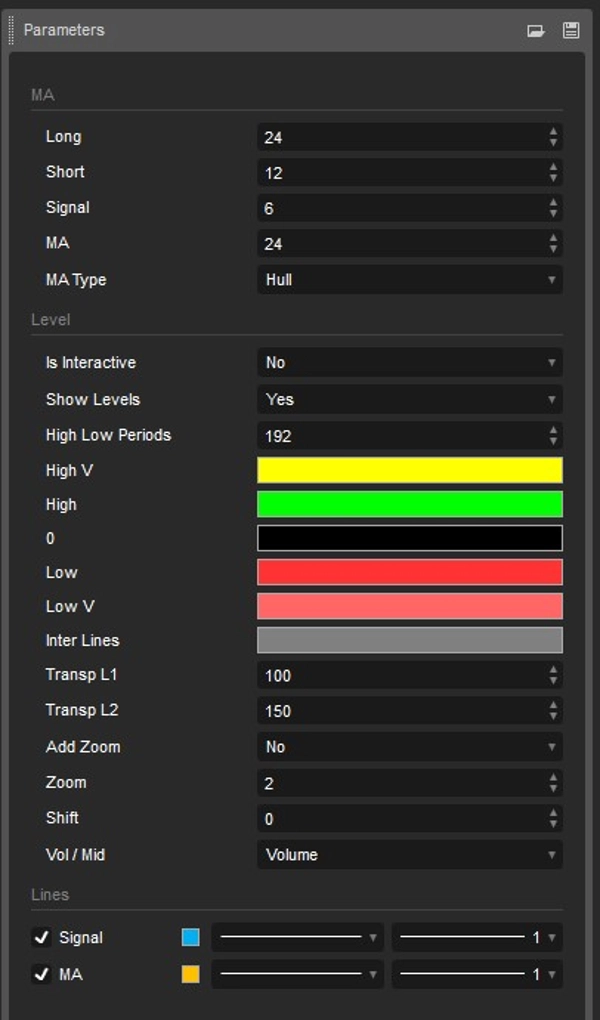
- Konfigurowalna średnia krocząca:
-
- Zawiera dodatkową średnią kroczącą, którą możesz wybrać z dostępnych opcji, co pozwala na większą personalizację i dostosowanie do Twojej strategii handlowej.
- Maksima i minima:
-
- Wyświetla najwyższe i najniższe poziomy w wybranym okresie, zapewniając wyraźny obraz ekstremów rynkowych.
Korzyści:
- Przejrzystość wizualna: Dynamiczne zmiany kolorów ułatwiają identyfikację trendów i punktów zwrotnych na rynku.
- Personalizacja: Możliwość wyboru różnych średnich kroczących i dostosowania poziomów kolorów pozwala dopasować wskaźnik do Twoich indywidualnych potrzeb.
- Efektywność: Automatyczne powiększanie zapewnia zawsze najlepszy widok wskaźnika bez konieczności ręcznych korekt.
- Kompleksowa analiza: Uwzględnienie wolumenu oraz poziomów maksymalnych i minimalnych daje pełniejszy obraz rynku.
Idealne dla:
- Traderów poszukujących zaawansowanego i konfigurowalnego narzędzia do ulepszenia analizy technicznej.
- Osób, które chcą jasnej i dynamicznej wizualizacji trendów rynkowych.
- Użytkowników ceniących efektywność i personalizację w swoich narzędziach handlowych.
Z dodatkowymi narzędziami takimi jak
OrderPrice V3 https://ctrader.com/products/397
NTMPICLL https://ctrader.com/products/327
Range Box Level https://ctrader.com/products/245
Or RangeBoxFibonacci https://ctrader.com/products/526
Market Session https://ctrader.com/products/525
MacdVolume https://ctrader.com/products/267
4MA https://ctrader.com/products/247
Będziesz niepokonany
Powodzenia 😀
Podsumowanie
Podsumowanie AI
The MACDVolume indicator is an advanced technical analysis tool combining the Moving Average Convergence Divergence (MACD) histogram with volume data for enhanced market trend visualization. It features dynamic color changes in the MACD histogram: bullish trends are shown by a gradient from green to white, while bearish trends shift from red to white. The volume component uses color-coded bars—green for increasing volume and red for decreasing volume—with additional colors (yellow, brown) to clearly depict buying and selling activity.
Key functionalities include auto zoom, which keeps the indicator centered and optimally scaled without manual adjustment, and a customizable moving average that can be selected from available options to fit different trading strategies. The indicator also displays the highest and lowest price levels within the selected period, providing insight into market extremes.
Designed for traders seeking a customizable and efficient tool, MACDVolume offers clear visual cues for trend identification and comprehensive market analysis by integrating volume and price extremes. It supports markets such as Forex and Stocks and is suitable for users who prioritize clarity, customization, and efficiency in their technical indicators.
Profil wskaźnika
Opinie klientów
5.0
Opinie: 3
5 | 100 % | |
4 | 0 % | |
3 | 0 % | |
2 | 0 % | |
1 | 0 % |
Opinie klientów
January 12, 2026
August 28, 2025
MACDVolume is a strong complementary tool for traders already using MACD. It enhances decision-making by incorporating volume, making signals more trustworthy.
April 17, 2025
Dyskusja
Częste pytania
Forex
Stocks
MACD
Produkty dostępne za pośrednictwem cTrader Store, w tym boty handlowe, wskaźniki i wtyczki, dostarczane są przez deweloperów zewnętrznych i udostępniane wyłącznie w celach informacyjnych oraz w celu zapewnienia dostępu technicznego. cTrader Store nie jest brokerem i nie zapewnia doradztwa inwestycyjnego, nie udziela spersonalizowanych rekomendacji ani nie gwarantuje przyszłych wyników.


Cena
147
Sprzedaż
11.17K
Bezpłatne instalacje