
説明
📈 PineScriptLabs Smart Signals CDRC [Auto TP/SL]
❓ What is this indicator?
The Dynamic Close Range Channels (CDRC) system is an indicator developed under PineScriptLabs theory that uses two independent channels to generate buy/sell signals 📊 and automatically calculate dynamic profit targets (TP) and stop loss (SL) 🎯 that are never the same.
🎯 Special Dynamic TP/SL Algorithm ⚡
Unlike systems using fixed levels or ATR, this algorithm calculates TP and SL based on the actual price movement from the last signal:
• For LONG 📈: Measures the distance from the lowest recorded price to entry, calculates the percentage of that movement, and projects that same percentage upward to establish targets
• For SHORT 📉: Measures the distance from the highest recorded price to entry, and projects that percentage downward
🎯 This means each trade has unique levels adapted to the specific market context at that moment, reflecting the real momentum before the signal 💡
📊 The CDRC Theory: Channel Construction 🏗️
Technical Foundation 🔍
The CDRC theory builds channels based exclusively on closing price ranges, not on volatility or standard deviation. Closings represent the real market consensus and eliminate wick noise 🎯
Construction Process ⚙️
- Average Price: Average of all period closings
- Range: Difference between highest and lowest closing of the period
- Amplitude: Range × Multiplier ÷ 2
- Bands:
o Upper = Average Price + Amplitude ↗️
o Lower = Average Price - Amplitude ↘️
🔄 Channels are recalculated on each bar, constantly adapting to the market
⚙️ How does it work?
Two Simultaneous Channels 📊📊
• Channel 1 (Fast - 111 bars): Reacts fast to changes, multiplier 0.14 ⚡
• Channel 2 (Slow - 388 bars): Long-term vision, multiplier 0.11 🐢
Signal Generation 🎯
• LONG ✅: Price closes above upper band of BOTH channels for 2 consecutive bars 🟢
• SHORT ✅: Price closes below lower band of BOTH channels for 2 consecutive bars 🔴
🛡️ Dual confirmation filters false signals
🤖 Automatic TP/SL Calculation (Algorithm Detail)
For LONG 📈:
- System continuously records the lowest price since last signal
- When generating buy signal, calculates: Percentage = (Entry - Minimum) / Entry × 100
- Projects that percentage upward from entry to establish TP3
- Divides range into three zones: TP1 (33%), TP2 (66%), TP3 (100%)
- SL = Entry - (Entry × Percentage × Stop Loss Ratio / 100)
For SHORT 📉:
- System continuously records the highest price since last signal
- When generating sell signal, calculates: Percentage = (Maximum - Entry) / Entry × 100
- Projects that percentage downward from entry to establish TP3
- Divides range into three progressive zones
- SL = Entry + (Entry × Percentage × Stop Loss Ratio / 100)
🎯 Result: Each trade has unique levels calculated according to the specific market momentum at that moment
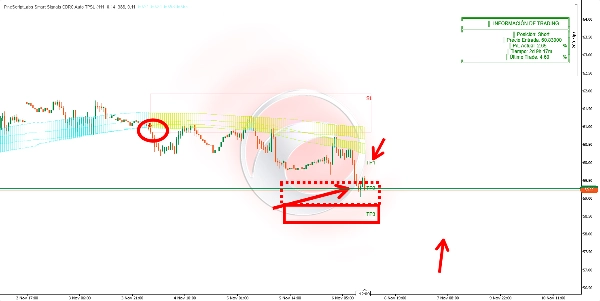
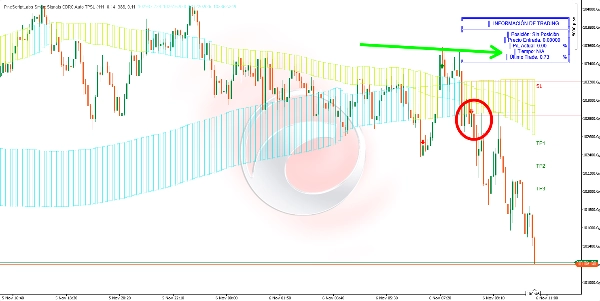
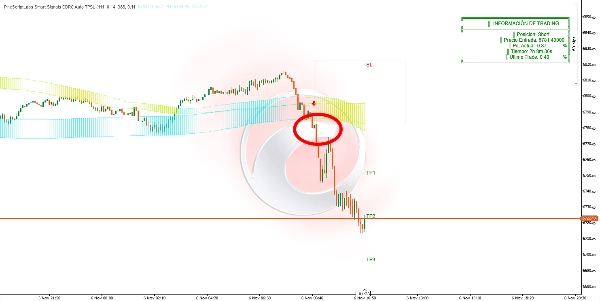
👀 Visualization 🎨
• Points: Bands of both channels
• Dynamic fill: Channels change color when penetrated
• Boxes: Entry zone (SL-Entry) and three target zones (progressive transparencies)
• Labels: SL, TP1, TP2, TP3 with exact prices 🏷️
• Arrows: Green (buy) 🟢 / Red (sell) 🔴
• Table: Current position, Entry price, Current P/L %, Time in trade, Last closed trade 📋
🎯 What is it for?
- High probability entries with dual timeframe confirmation ✅
- Adaptive automatic risk management based on actual market movement 🤖
- Unique staggered targets for each trade according to previous momentum 🎯
- Dynamic adaptation to recent price behavior 🔄
- Real-time monitoring of position performance 📊
🛠️ How to use it?
Entry 🚀: Enter at closing of bar when arrow appears
Management 💼:
• TP1: 33% of projected movement (partial profits) 💰
• TP2: 66% of movement (more profits) 💰💰
• TP3: 100% of movement (final target) 🎯
• SL: Always respect automatic stop loss ⛔
Monitoring 👀: Table shows current P/L in real time. System automatically detects when TP3 or SL is reached. Only one active signal at a time ⚠️
⚙️ Parameters and Impact
Channel 1 Period (111):
• ↑ More bars = Fewer signals, more reliable, slower 🐢
• ↓ Fewer bars = More signals, faster, more sensitive ⚡
Channel 1 Multiplier (0.14):
• ↑ Higher = Wide bands, fewer signals, only strong movements 💪
• ↓ Lower = Narrow bands, more signals, greater sensitivity 🎯
Channel 2 Period (388):
• ↑ Higher = Strict confirmation, fewer signals 🛡️
• ↓ Lower = More signals, less filtering 📊
Channel 2 Multiplier (0.11):
• ↑ Higher = Strict filtering, conservative 🎯
• ↓ Lower = Higher sensitivity, more trades ⚡
Stop Loss Ratio (50%):
• 50% = 1:2 ratio (professional balance: risk 1, profit 2) ⚖️
• ↑ Towards 100% = Wide SL, more risk, fewer stop outs, worse R:R 📉
• ↓ Towards 1% = Tight SL, less risk, better R:R, more stop outs 📈
🔑 Key Considerations
• Market memory 🧠: Records price extremes from last signal for realistic and unique projections
• TP/SL never equal ⚖️: Each trade has levels calculated according to its specific context
• Mandatory dual confirmation for 2 consecutive bars ✅✅
• Only one active signal at a time ⚠️
• Channels constantly recalculate adapting to market 🔄
• Boxes extend visually to maintain visibility 👀
🚀 10,000+ traders already use our TOP indicators🏆
👉 Get all our TOP systems here:
_______________________________________________
📌 Market Structure Indicators
· ✅ AdvancedMarket Structure: Bos, Choch, SwinLevels, Order Blocks, Market Structure& Liquidity Finder
· 🔄 Dynamic Market StructureAnalysis of Turning Points
· 🧱 Order Block
· ⚖️ Market Imbalance
· ⛓️ BOS & CHOCH
· 🧠 ICT Power of 3
_______________________________________________
🔚 Smart Exit Systems
_______________________________________________
📐 ZigZag Indicators
· 🔍 ZigZag Price LiquidityProjection
· ➖ ZigZag
_______________________________________________
🧱 Support & Resistance Indicators
· 🟩 SmartTrend Support &Resistance Lines
· 🧱 All Support and ResistanceLevels
_______________________________________________
📊 Trend & Channel Indicators
· 📊 Supertrend
_______________________________________________
💧 Volume & Liquidity Tools
_______________________________________________
⚡ Momentum & RSI Indicators
· 🔎 Multi-Level Candle Bias
Tracker
_______________________________________________
🔮 Prediction & Projection Tools
· 📐 Prediction Based on Linreg& ATR
· 📏 Fibonacci Linear RegressionMulti-timeframe
· 📈 Volume-Powered Market Flow Projector
概要
カスタマーレビュー
5 | 67 % | |
4 | 0 % | |
3 | 33 % | |
2 | 0 % | |
1 | 0 % |


