
说明
🚀 超过10,000名交易者已使用我们的顶级指标🏆
发现为什么专业人士选择我们——最强大的工具在 cTrader(指标、算法和cBots)正等着您。
👉 在这里获取我们所有的顶级系统:
_______________________________________________
_______________________________________________
📌 市场结构指标
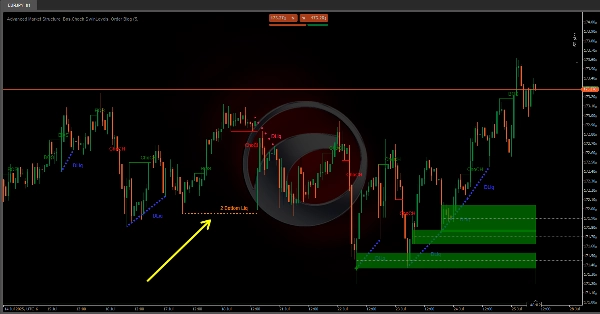
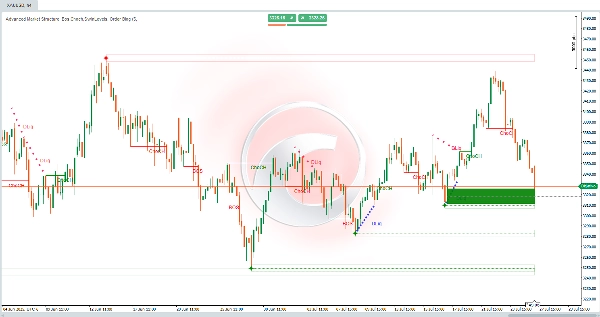
· ✅ 高级市场结构:Bos、Choch、SwinLevels、订单区块, 市场结构& 流动性发现器
· 🔄 动态市场结构转折点分析
· 🧱 订单区块
· ⚖️ 市场失衡
· ⛓️ BOS & CHOCH
· 🧠 ICT 三力合一
· 🌀 市场极性区
______________________________________________________________-
商店cBots : 🧠 黄金 & BTC 突破交易时段枢轴 🧠
_______________________________________________
🔚 智能退出系统
· 📍 尾随智能算法
_______________________________________________
📐 之字形指标
· 🔍 之字形价格流动性投影
· 🧭 支撑阻力结构之字形
· ➖ 之字形
· 🎯 之字形极端追踪器
_______________________________________________
🧱 支撑与阻力指标
· 🟩 智能趋势支撑与阻力线
· 🧱 所有支撑和阻力水平
_______________________________________________
📊 趋势与通道指标
· 🔄 自动趋势通道
· 📊 超级趋势
· ⚡动量趋势分析器
· 🧠 自适应趋势通道
· 💥 通道突破系统
· 🌈 动态趋势梯度
· ⭐ 高级SSL通道
· 🔁 反应式移动平均线
_______________________________________________
💧 成交量与流动性工具
· 🔥 成交量POC热力图
· 📉 杠杆清算图
· 🔍 动量公平价值缺口
· 🕒 公平价值缺口时段
_______________________________________________
⚡ 动量与RSI指标
· 📈 RSI趋势触发器
· 🚀 动态范围动量
· 🔎 多级蜡烛偏差追踪器
_______________________________________________
🔮 预测与投影工具
· 📐 基于线性回归和ATR的预测
· 📏 斐波那契线性回归多时间框架
· 📈 成交量驱动的市场流动投影器
📉 斐波那契扇形
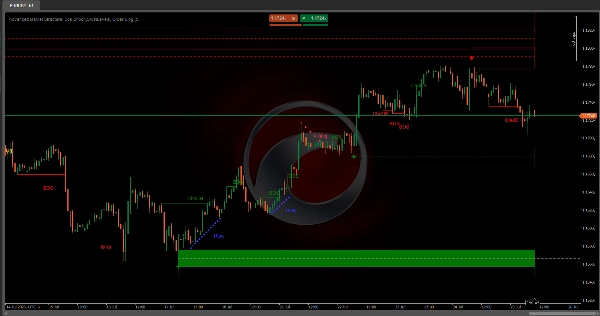
高级市场结构:Bos、Choch、SwinLevels、订单区块, 市场结构与流动性发现器。
它是什么?
一款 高级价格行为工具 将多种技术分析概念融合为一个强大的指标。集成了:
- 📊 市场结构
- 🔄 摆动水平
- 🧱 订单区块
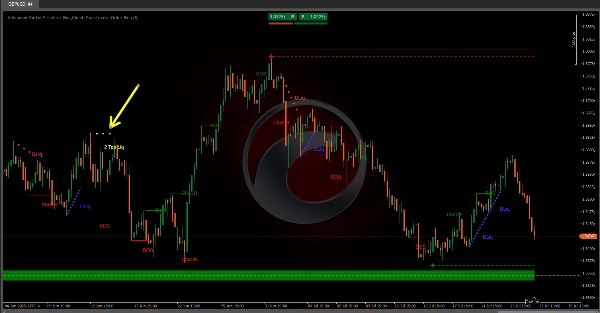
- 💧 流动性发现器 (2个底部 & 2个顶部)
目标:识别关键进出点、趋势、支撑/阻力及价格反应的机构区域。
🧠 核心理念:聪明资金
市场由 机构参与者 (银行、基金、做市商)驱动,他们拥有更强大的资源。他们创造模式以:
- 🕵️♂️ 隐藏操作 于积累/分配期间。
- 🎯 猎取流动性 (散户止损)。
- 🚀 推动爆发性行情 于不平衡市场。
🔑 组成部分:
1. 订单区块
- 定义:机构执行大量订单的区域,造成市场失衡。
- 类型:
-
- 🟢 看涨(需求):机构积极买入。
- 🔴 看跌(供应):机构积极卖出。
- 关键信号:价格在订单区块处反弹/反转。
- 检测方法:
-
- 成交量在高点(看跌)或低点(看涨)附近激增。
2. 摆动水平
- 目的:通过关键高点/低点定义市场结构。
- 关键突破:
-
- 🔺 摆动高点突破:看涨延续。
- 🔻 摆动低点突破:看跌延续。
3. 结构突破 (BoS)
- 定义:决定性突破摆动高点(看涨)或低点(看跌)。
- 分形连接:
-
- 🐂 看涨分形:5根蜡烛图,中间为最低点。
- 🐻 看跌分形:5根蜡烛图,中间为最高点。
4. 性质变化 (ChoCh)
- 定义:结构性转变,标志趋势反转。
- 触发条件:
-
- 上升趋势中突破摆动低点(看跌ChoCh)。
- 下降趋势中突破摆动高点(看涨ChoCh)。
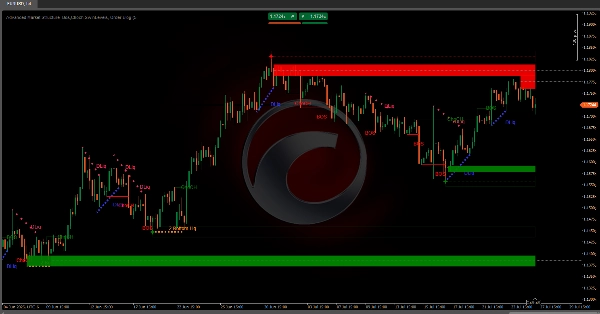
5. 流动性区
- 类型:
-
- ⚖️ 静态:水平线,聚集高点/低点(ATR过滤)。
- 🏃 动态:连接陡峭枢轴的趋势线。
- 关键模式:
-
- 🕯️ 2个顶部/2个底部:机构止损猎杀。
- ⛰️ 三重顶部/底部:高密集区。
🎯 关键应用
- ✅ 通过BoS/ChoCh识别趋势/反转。
- 📍 使用摆动水平和流动性区定位支撑/阻力。
- 🏦 发现机构订单区块。
- 🎯 通过流动性区预测价格目标。
🔄 聪明资金策略
阶段信号机构行为
1. 积累
ChoCh看涨 + 需求订单区块 📈
聪明资金买入
2. 上涨
连续BoS + FVG缺口 🚀
散户推动动量
3. 分配
ChoCh看跌于2顶流动性 🎯
聪明资金卖出
4. 下跌
看跌BoS + 折扣区清算 🔻
低点止损猎杀
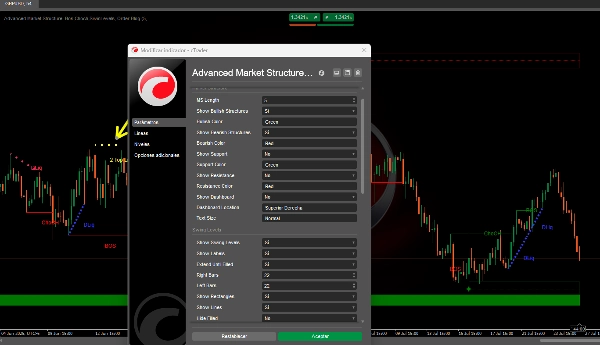
⚙️ 参数调优指南
市场结构
MS长度:-
- ⬆️ 增加:更少但更可靠的分形。
- ⬇️ 减少:更敏感(噪音风险)。
摆动水平
摆动大小L/R:-
- ⬆️ 增加:识别重要摆动。
- ⬇️ 减少:捕捉小幅反转。
延伸直到被填补:-
- ✅ 启用:水平线持续存在直到价格触及。
订单区块
缓解方法:-
- ✨
影线:更快信号(触及影线)。 - 🎯
收盘价:更强信号(收盘价在区块外)。
- ✨
流动性发现器
静态/动态敏感度:-
- ⬆️ 增加:更少区域(更高质量)。
- ⬇️ 减少:更多区域(更高敏感度)。
摘要
Key components include:
- **Order Blocks:** Zones of significant institutional buying (bullish) or selling (bearish) identified by volume spikes near highs or lows, signaling potential price rebounds or reversals.
- **Swing Levels:** Critical highs and lows defining market structure, with breaks indicating bullish or bearish continuations.
- **Break of Structure (BoS):** Decisive breaks of swing highs or lows, linked to fractal patterns, signaling trend direction.
- **Change of Character (ChoCh):** Structural shifts indicating trend reversals, triggered by breaking swing lows in uptrends or swing highs in downtrends.
- **Liquidity Zones:** Static (horizontal levels with clustered highs/lows) and dynamic (trendlines connecting pivots) zones highlighting institutional stop hunts and congestion areas.
The indicator supports smart money concepts, reflecting institutional market behavior phases: Accumulation, Markup, Distribution, and Markdown. Parameter tuning options allow adjustment of sensitivity and signal strength for Market Structure, Swing Levels, Order Blocks, and Liquidity Finder components. This tool aims to enhance market analysis by revealing institutional activity and improving trade decision-making.
客户评价
5 | 33 % | |
4 | 67 % | |
3 | 0 % | |
2 | 0 % | |
1 | 0 % |


