
ZigZag
インジケーター
4.05K ダウンロード数
バージョン 1.0、Jan 2025
Windows、Mac
4.3
レビュー: 6
説明
Pinescriptlabs ストアのインジケーター: Pinescriptlabs ストア cBots : (cBot) Gold & BTC ブレイクアウトセッションピボット(新着)
高度なマーケット構造:Bos、Choch、SwinLevels、オーダーブロック、 マーケット構造&流動性ファインダー (新着)
トレーリングスマートアルゴリズム (新着)
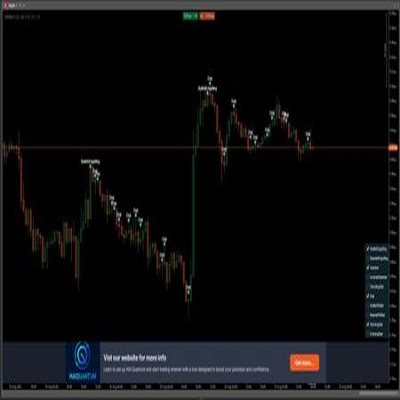
ジグザグインジケーター:市場トレンドの簡素化 📉📈
ジグザグは、資産の重要なトレンド変化を特定するのに役立つテクニカルインジケーターであり、小さな市場の動きをフィルタリングします。その主な目的は、小さな変動の「ノイズ」を排除して視覚的な価格分析を簡素化することです。
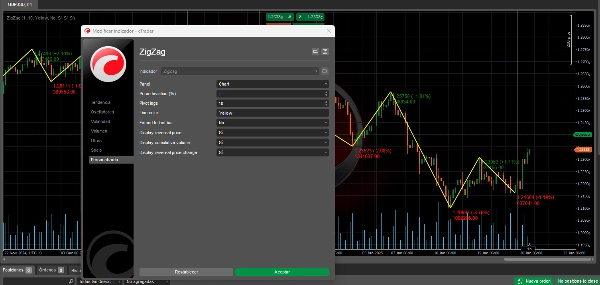
仕組み ⚙️
- 📊 価格を分析して重要な転換点(ピボット)を見つけます。
- 📈 価格が特定の最小パーセンテージ(偏差パラメーター)で変化した場合、その転換点は重要と見なされます。
- 🔗 これらの転換点を直線で結び、「ジグザグ」パターンを形成します。
- 🕒 新しい価格データが出ると動的に更新されます。
トレーディングユーティリティ 💡
トレンド識別 📐
- 🔍 主要な市場方向を視覚化するのに役立ちます。
- 🚀 強気および弱気のトレンドを見つけやすくします。
- 📏 主要なサポートおよびレジスタンスレベルを明確に強調します。
パターン分析 📋
- 🎯 チャートパターンの識別を簡素化します。
- 🕵️♂️ 三角形、フラッグ、その他のパターンの価格形成を強調します。
- 🌊 エリオット波動の認識を明確にします。
トレード管理 🎛️
- 🎯 潜在的なエントリーおよびエグジットポイントを特定します。
- 🛡️ 以前のピボットに基づいてストップロスレベルを決定するのに役立ちます。
- 🎯 現実的な価格目標の設定を促進します。
ボラティリティ分析 🌡️
- 📏 ピボット間の距離は市場のボラティリティを反映します。
- 🧩 動きの大きさに応じて戦略を調整するのに役立ちます。
- ⏳ 集約期間と方向性トレンドを区別します。
シグナル確認 ✅
- 🔍 他のインジケーターの確認ツールとして機能します。
- 🚪 主要レベルのブレイクアウトを検証します。
- 🔗 より堅牢な戦略のために他のインジケーターと組み合わせることができます。
重要な考慮事項 🧠
これは回顧的です 📅
- ⏪ ピボットポイントは動きが起こった後にのみ確認されます。
- 🔮 それ自体では予測的ではありません。
- ⚖️ 意思決定には他のインジケーターと組み合わせて使用するべきです。
パラメーター調整 🔧
- 🎚️ 感度は設定された偏差パーセンテージに依存します。
- 🔍 小さいパーセンテージはより多くのピボットポイントを表示します。
- 🧹 大きいパーセンテージは小さな動きをフィルタリングし、重要な変化のみを表示します。
タイムフレームの使用 🕒
- 🕰️ どのタイムフレームでも機能します。
- 🔄 パラメーターは取引の期間に基づいて調整する必要があります。
- 🌐 複数のタイムフレームで分析することで、より包括的な視点が得られます。
📈 ジグザグインジケーターを強力なツールとして使用し、分析を簡素化し、トレンドを特定し、トレーディングの意思決定を向上させましょう! 🚀
概要
AIによる概要
The ZigZag indicator is a technical analysis tool designed to identify significant trend changes by filtering out minor price fluctuations. It works by detecting key turning points (pivots) where price changes exceed a specified minimum percentage (deviation parameter). These pivots are connected with straight lines to form a zigzag pattern that updates dynamically with new price data.
Key functionalities include:
- Trend Identification: Visualizes primary market direction, highlights bullish and bearish trends, and marks key support and resistance levels.
- Pattern Analysis: Simplifies recognition of chart patterns such as triangles, flags, and Elliott waves.
- Trade Management: Assists in identifying entry and exit points, setting stop-loss levels based on previous pivots, and establishing realistic price targets.
- Volatility Analysis: Reflects market volatility through pivot distances, aiding strategy adjustments and distinguishing consolidation from trending phases.
- Signal Confirmation: Validates breakouts and complements other indicators for robust trading strategies.
The indicator is retrospective, confirming pivots only after price movements occur, and is not predictive on its own. Sensitivity can be adjusted via the deviation percentage to show more or fewer pivot points. It is compatible with any timeframe and benefits from multi-timeframe analysis for comprehensive market views.
This tool supports analysis across various markets including cryptocurrencies (BTCUSD), commodities (XAUUSD), and others, and integrates with related indicators like RSI, ATR, and Supertrend.
インジケーターのプロフィール
カスタマーレビュー
4.3
レビュー: 6
5 | 50 % | |
4 | 33 % | |
3 | 17 % | |
2 | 0 % | |
1 | 0 % |
カスタマーレビュー
July 9, 2025
Pros: Simple and flexible settings, clear swing visualization, stable performance on major assets. Cons: No alerts or Fibonacci tools, lacks swing statistics, requires additional confirmation for trading decisions.
May 19, 2025
This just takes emotion away from trading. its great good work pal. i would also like to buy the source code from you.
ディスカッション
よくあるご質問
BTCUSD
Signal
Breakout
Supertrend
Commodities
RSI
Crypto
XAUUSD
ATR
cTrader Storeで入手可能な取引ボット、インジケーター、プラグインなどの商品は、第三者の開発者が提供するものであり、情報と技術の取得のみを目的としてご利用いただけます。cTrader Storeはブローカーではなく、投資助言や個人的な推奨を行うことも、将来のパフォーマンスを保証することもありません。


![「[Stellar Strategies] QQE」ロゴ](https://cdn.ctrader.com/image/webp/e702104a-874c-4b39-97dd-fb34518d1015_27712)


価格
登録日 03/10/2024
163
販売
37.9K
無料インストール