Descrizione
Pinescritlabs Ctrader Store indicatori :
Dynamic Market Structure
Analisi dei Punti di Svolta
Fibonacci Linear
Regressione Multi-timeframe
Multi-Level Candle Bias
Tracker
Auto Support and
Resistance Trend Lines
All Support and
Resistance Levels
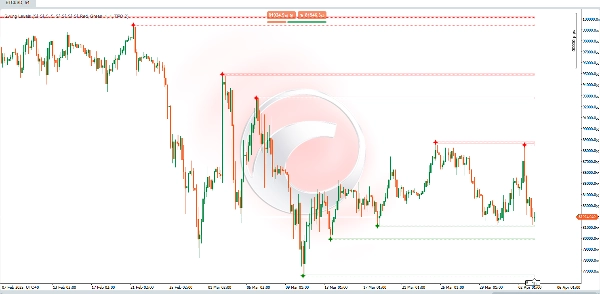
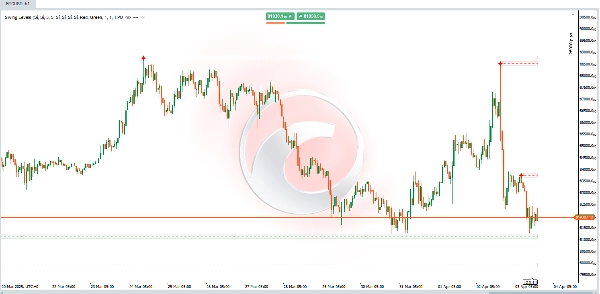
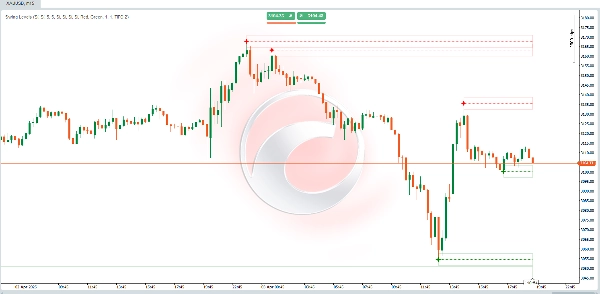
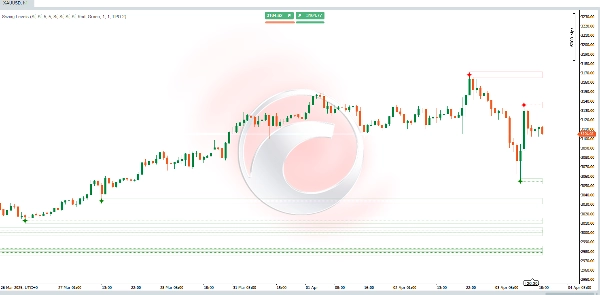
🔍 Livelli Swing
Questo indicatore è progettato per rilevare automaticamente livelli di supporto e resistenza basati su "swings" o pivot nel grafico (cioè, massimi e minimi significativi). Una volta identificati questi punti, disegna linee o zone (rettangoli) che fungono da riferimenti chiave per l'azione del prezzo e le decisioni di trading.
🛠 Caratteristiche Principali:
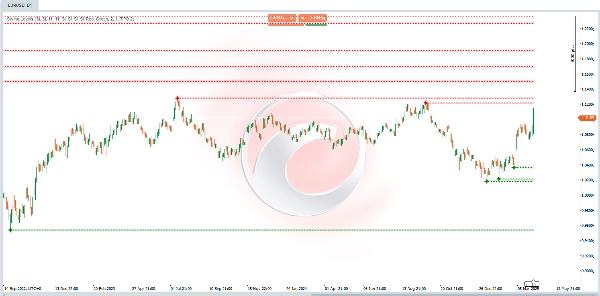
✅ Identificazione dei Livelli Chiave: Evidenzia dove si sono formati gli ultimi massimi swing e minimi swing. Questi livelli spesso agiscono come supporto o resistenza in futuro.
✅ Analisi della Struttura di Mercato: Aiuta a visualizzare se il mercato sta formando massimi più alti e minimi più alti (rialzista) o massimi più bassi e minimi più bassi (ribassista)—essenziale per l'identificazione della tendenza e potenziali punti di inversione.
✅ Strumento per la Decisione: I trader possono usare questi livelli per determinare punti di ingresso, posizionamenti di stop-loss o zone di take-profit, sfruttando supporti e resistenze dinamici.
🧠 Come Funziona?
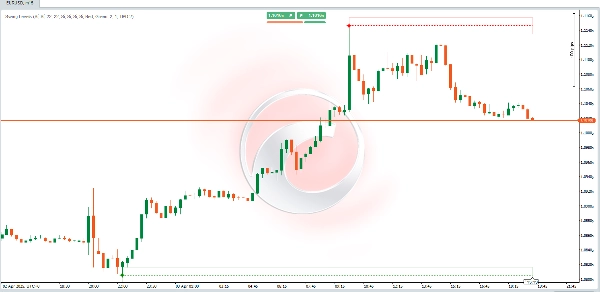
1️⃣ Rilevamento Pivot (Swing High & Swing Low)
📌 L'indicatore analizza un numero definito di candele/barre a sinistra e destra (parametri: "Left Bars" & "Right Bars").
📌 Per rilevare un Swing High, verifica se il massimo della barra centrale (pivot potenziale) è più alto dei massimi delle barre vicine all'interno dell'intervallo.
📌 Per rilevare un Swing Low, applica la stessa logica ma confrontando i minimi invece.
📊 Interpretazione dei Livelli Disegnati:
🔴 Massimi Swing → Potenziali Zone di Resistenza:
- Se il prezzo ritorna a questo livello, osserva un rifiuto (vendita) o una rottura (continuazione rialzista).
🟢 Minimi Swing → Potenziali Zone di Supporto:
- Se il prezzo rivisita questo livello, osserva un rimbalzo (acquisto) o una rottura al ribasso (continuazione ribassista).
Riepilogo
Key features include:
- Identification of recent swing highs and lows, which often act as future support or resistance.
- Visualization of market structure by highlighting patterns of higher highs and lows (bullish) or lower highs and lows (bearish), aiding trend recognition and reversal detection.
- A decision-making tool for traders to set entry points, stop-losses, and take-profit zones based on dynamic support and resistance.
Swing highs indicate potential resistance zones where price may reject or break out, while swing lows indicate potential support zones where price may bounce or break down. This indicator supports analysis across various markets and timeframes by providing clear visual cues of market turning points.
Recensioni dei clienti
5 | 0 % | |
4 | 100 % | |
3 | 0 % | |
2 | 0 % | |
1 | 0 % |