Descrizione
🚀 Oltre 10.000 trader utilizzano già i nostri indicatori TOP🏆
Scopri perché i professionisti ci scelgono – gli strumenti più potenti su cTrader (indicatori, algoritmi e cBots) ti aspettano.
👉 Ottieni tutti i nostri sistemi TOP qui:
_______________________________________________
_______________________________________________
📌 Indicatori di Struttura di Mercato
· ✅ AdvancedMarket Structure: Bos, Choch, SwinLevels, Order Blocks, Market Structure& Liquidity Finder
· 🔄 Analisi Dinamica della Struttura di Mercato dei Punti di Inversione
· 🧱 Order Block
· ⚖️ Market Imbalance
· ⛓️ BOS & CHOCH
· 🧠 ICT Power of 3
· 🌀 Zone di Polarità di Mercato
______________________________________________________________-
Store cBots : 🧠 Gold & BTC BreakoutSession Pivots 🧠
_______________________________________________
🔚 Sistemi di Uscita Intelligenti
· 📍 Algoritmo Intelligente di Trailing
_______________________________________________
📐 Indicatori ZigZag
· 🔍 Proiezione della Liquidità del Prezzo ZigZag
· ➖ ZigZag
· 🎯 Tracciatore di Estremità Zig-Zag
_______________________________________________
🧱 Indicatori di Supporto e Resistenza
· 🟩 Linee di Supporto e Resistenza SmartTrend
· 🧱 Tutti i Livelli di Supporto e Resistenza
_______________________________________________
📊 Indicatori di Trend e Canale
· 🔄 Canale di Trend Automatico
· 📊 Supertrend
· ⚡Analizzatore di Trend Momentum
· 💥 Sistema di Breakout del Canale
· 🌈 Gradiente di Trend Dinamico
_______________________________________________
💧 Strumenti di Volume e Liquidità
· 🔥 Mappa di Calore Volume POC
· 📉 Mappa di Liquidazione Leva
_______________________________________________
⚡ Indicatori Momentum e RSI
· 🔎 Tracciatore di Bias a Candela Multi-Livello
_______________________________________________
🔮 Strumenti di Previsione e Proiezione
· 📐 Previsione Basata su Linreg& ATR
· 📏 Regressione Lineare di Fibonacci Multi-timeframe
· 📈 Proiettore di Flusso di Mercato Alimentato dal Volume
_________________________________________________________________________________
_________________________________________________________________________________
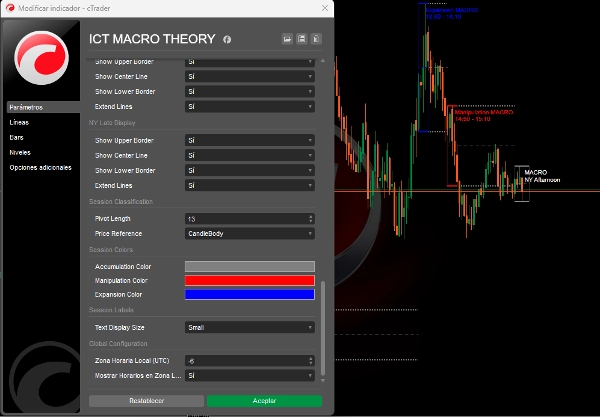
🌐 TEORIA MACRO ICT
⚠️ NOTA IMPORTANTE: Questo indicatore funziona solo su timeframe inferiori a 5 minuti.
Spiegazione dei Periodi Macro ICT
I periodi macro ICT sono essenzialmente brevi intervalli durante i quali l'algoritmo cerca liquidità o aggiusta il prezzo per i fair value gap. La base di questi macro ICT risiede nella teoria del tempo e del prezzo di ICT.
Un macro è "una breve serie di istruzioni che crea un evento nella consegna del prezzo", come definito dallo stesso ICT.
I macro ICT non sono strategie di trading complete, ma possono aggiungere congiunzione ai tuoi trade e massimizzare i profitti. Si verificano durante le sessioni di Londra, New York, mezzogiorno e pomeriggio.
🔮 Implementazione Avanzata della Teoria dei Tempi Macro ICT:
Connessione Diretta ai Concetti ICT:
Il codice implementa esattamente i 3 tipi di macro ICT descritti nella teoria, utilizzando una logica di classificazione basata su:
- Analisi della Struttura di Mercato:
-
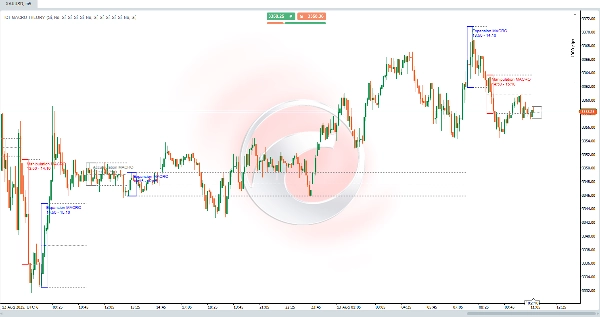
- Rilevamento delle Sessioni Macro
- Registra gli orari ICT esatti (Londra 02:33, NY 09:50, ecc.).
- Rileva cambiamenti strutturali prima e durante ogni sessione macro.
- Classifica automaticamente in:
-
- 🟥 Manipolazione: Quando il prezzo spazza la liquidità su entrambi i lati (acquisto/vendita).
- 🟦 Espansione: Movimenti direzionali che prendono liquidità da un lato (allineati al trend).
- 🟩 Accumulo: Gamma stretta dove il prezzo "accumula" liquidità.
- Livelli Chiave Estesi:
-
- Disegna massimi/minimi di ogni sessione macro.
- Calcola ed estende il prezzo medio (punto medio) alla sessione successiva.
- Questi livelli agiscono come supporto/resistenza dinamici (Essenziali in ICT!).
- Rilevamento della Liquidità in Tempo Reale:
-
- Utilizza dati a 1 minuto per identificare pivot esatti (uguali a quelli visti su timeframe inferiori).
Miglioramenti e Aggiornamenti Futuri:
- Rilevamento di Sweep di Liquidità: Identificherà precedenti sweep di liquidità (massimi/minimi giorno/settimana precedenti).
- Fair Value Gaps (FVG): Rileverà e visualizzerà i fair value gap.
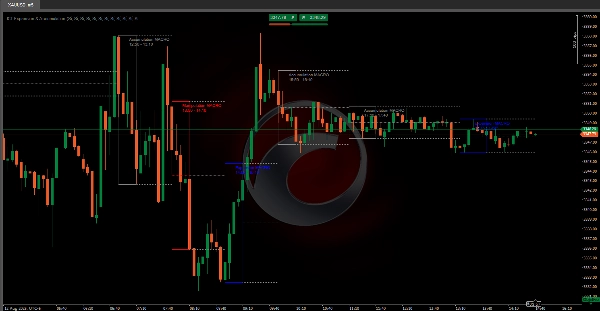
📊 Esempio Pratico ICT
Scenario di Apertura NY (09:50-10:10):
- Pre-sessione: Il prezzo spazza la liquidità dal lato acquisto (minimo locale).
- Durante la sessione:
-
- Classificato come 🟥 MANIPOLAZIONE.
- Il prezzo si sposta verso una struttura ribassista.
- Post-sessione:
-
- Le linee estese segnano la resistenza ai massimi della sessione.
- Rifiuto del trade nella zona con RR 1:3.
✅ Fedeltà al Principio ICT:
"I macro non sono strategie complete ma aggiungono congiunzione identificando dove gli algoritmi cercheranno liquidità."
Riepilogo
The indicator analyzes market structure and detects key macro sessions—London, New York, midday, and afternoon—recording exact ICT times. It classifies price behavior into three types of macros: Manipulation (price sweeps liquidity on both sides), Expansion (directional movement aligned with trend), and Accumulation (tight range where price accumulates liquidity). It also draws and extends session highs, lows, and average price levels to act as dynamic support and resistance.
Using 1-minute data, ICT MACRO THEORY detects precise pivots for real-time liquidity identification. While not a complete trading strategy, it adds confluence to trades by highlighting where algorithms seek liquidity. Planned updates include detection of liquidity sweeps and visualization of fair value gaps.
This tool is intended for traders seeking to incorporate ICT macro time concepts into their analysis for enhanced market structure insight and liquidity detection on very short timeframes.