
Deskripsi
Pinescritlabs
Indikator Toko Ctrader: 🤖Pinescritlabs Ctrader Store cBots:
Fair Value Gap Sessions Gold & BTC Breakout Session Pivots(baru)
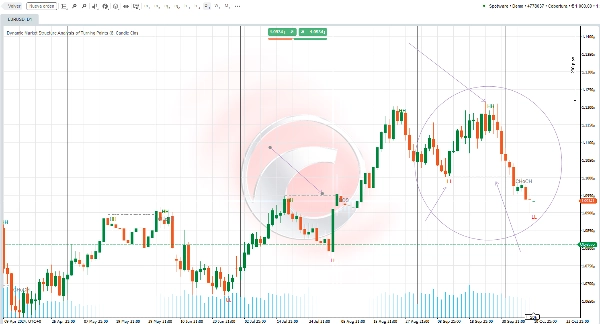
Dynamic Market Structure
Analisis Titik Balik
Fibonacci Linear
Regresi Multi-timeframe
Multi-Level Candle Bias
Tracker
Auto Support and
Resistance Trend Lines
All Support and
Resistance Levels
Ikhtisar Pengaturan Indikator 🌟
PANJANG AYUNAN 📏
Parameter ini menentukan berapa banyak bar yang dipertimbangkan ke kiri dan kanan saat mencari titik ayunan. Nilai yang lebih rendah akan menampilkan lebih banyak titik, sementara nilai yang lebih tinggi akan mengurangi jumlahnya. Disarankan untuk menyesuaikan parameter ini berdasarkan gaya trading Anda dan saat beralih antara kerangka waktu yang berbeda.
CHOCH 🔄
Mengaktifkan opsi ini akan mengganti nama breakout counter-trend pertama menjadi CHoCH (Change of Character), sehingga menunjukkan kemungkinan perubahan arah pasar.
HH dan LL 📈📉
Indikator akan menggambar titik ayunan tinggi (HH) dan titik ayunan rendah (LL) pada grafik, memungkinkan Anda untuk memvisualisasikan struktur pasar dengan lebih efektif.
BOS ⚡
Indikator juga akan menampilkan level Break of Structure (BOS) saat mendeteksi breakout di titik ayunan, memberikan wawasan tambahan tentang dinamika pasar.
Ringkasan
Ulasan pelanggan
5 | 33 % | |
4 | 67 % | |
3 | 0 % | |
2 | 0 % | |
1 | 0 % |


