
説明
私たちの ATR強化型ORB(オープニングレンジブレイクアウト)インジケーターでトレードを変革しましょう!
これは、高確率のブレイクアウト機会を自動的に検出し、実際の市場のボラティリティに基づいてリスク管理を動的に調整する完全なプロフェッショナルトレーディングシステムです。
仕組み:
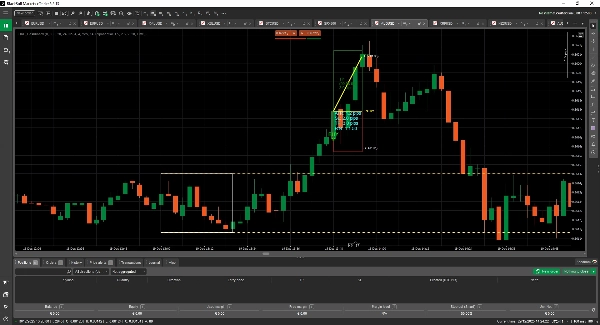
ステップ1:スマートなオープニングレンジ検出
- 重要なオープニングレンジ(OR)期間(設定可能な時間)を自動的に特定
- 機関投資家が注目する正確な高値/安値の境界を計算
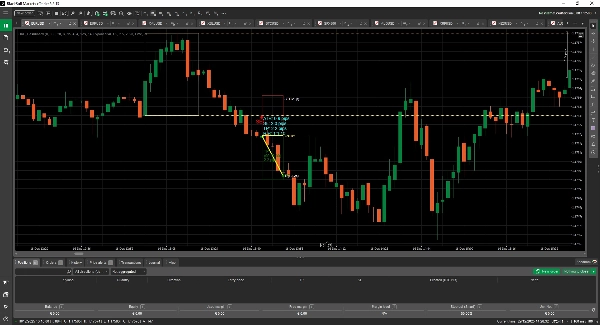
- セッション全体でのトレードを容易にする明確な視覚的拡張を描画
ステップ2:ブレイクアウト確認システム
- ORの境界線を超えた連続した終値を待つ(設定可能な1~10本のバー)
- 実証済みの確認ロジックで偽のブレイクアウトを排除
- 条件が満たされた場合のみプロフェッショナルなトレード矢印をプロット
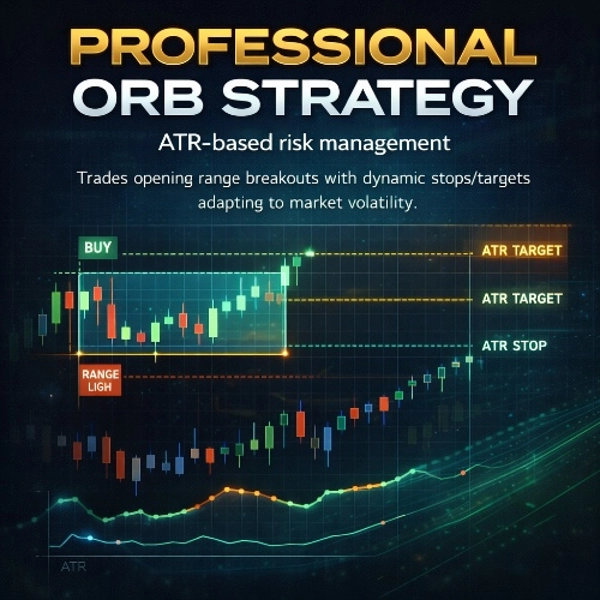
ステップ3:ATR適応型リスク管理
- 動的ストップ: 現在のATR(平均真の範囲)に基づいてストップロスを自動調整
- スマートターゲット: ATR乗数(1:1.5から1:5の比率)を使用して利食いレベルを設定
- ボラティリティ適応: 静かな市場ではタイトなストップ、変動の激しい市場では広いストップ
- 最低限の保護: 定義した最小ピップ距離を下回るストップは設定しない
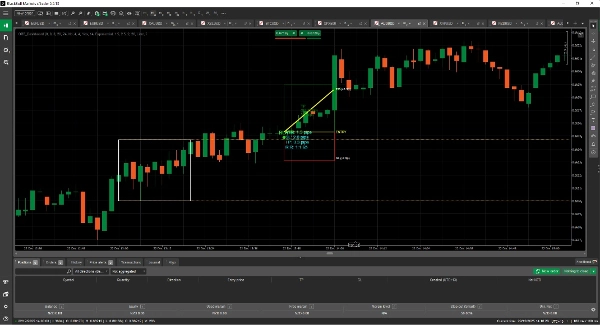
ステップ4:完全なトレード可視化
- 色分けされたTP/SLゾーン(利益は緑、ストップは赤)
- ピップ計算付きのリアルタイムATR値表示
- すべてのトレードでリスク・リワード比を表示
- トレード結果の追跡(TP/SL)と期間および獲得ピップ数
あなたに利益をもたらす主な特徴:
✅ プロフェッショナルグレードのATR統合
- ストップ/ターゲットは市場状況に自動調整
- ストップの設定場所を推測する必要なし!
- 任意の時間枠(M1から日足まで)に適応
✅ 再描画なし、書き換えなし
- 確認されたときのみシグナルが表示される
- 消える矢印や偽のシグナルなし
- トレードは分析のために表示されたまま
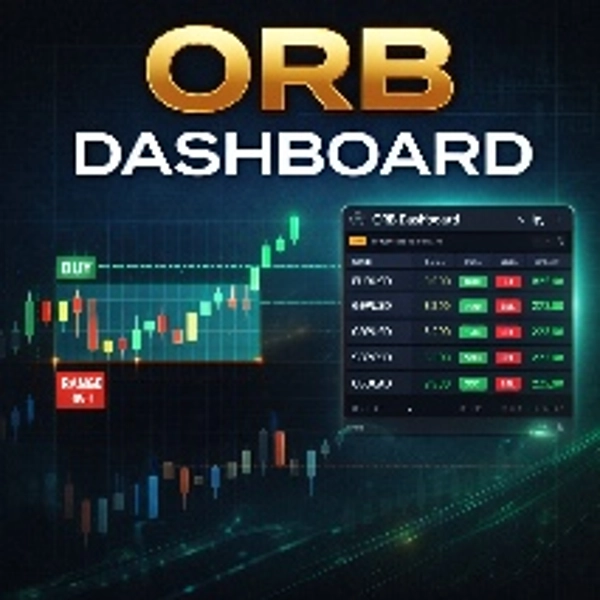
✅ 完全なビジュアルダッシュボード
- 拡張付きのオープニングレンジ高値/安値ライン
- ラベル付きのトレードエントリー/エグジットマーカー
- すべてのトレードのパフォーマンス統計
- クリーンでプロフェッショナルなチャート表示
✅ スマートトレード管理
- OR期間ごとに1トレード(過剰取引を防止)
- 自動TP/SLヒット検出
- トレード結果の追跡と統計
- エントリーからエグジットまでの視覚的トレードパス
✅ 完全カスタマイズ可能
- OR時間を任意の市場セッションに調整可能
- 確認要件を変更可能
- ATR乗数と期間をカスタマイズ可能
- 色や視覚設定を変更可能
対象ユーザー:
🔹 スイングトレーダー - プロのリスク管理で主要な日次ブレイクアウトをキャッチ
🔹 デイトレーダー - 低時間足でのオープニングレンジブレイクアウトをトレード
🔹 リスク回避型トレーダー - 感情ではなくATRでリスクを決定
🔹 アルゴリズムトレーダー - 自動システムのシグナルジェネレーターとして使用
🔹 トレーディング教育者 - ORB戦略とリスク管理の教育に最適なツール
なぜ自作ではなく当社のインジケーターを購入するのか?
- 実証済みのロジック - エントリー/エグジットロジックの長年の改良
- ATRインテリジェンス - 洗練されたボラティリティベースのポジションサイズ設定
- 製品準備済み - バグなし、複数市場でテスト済み
- 時間節約 - 数百時間の開発を低コストで実現
- サポート付き - 定期的なアップデートと技術サポート
技術要件:
- cTraderプラットフォームで動作
- すべての通貨ペアと時間枠に対応
- マルチチャート操作でも低CPU使用率
- 外部依存なし
リスク免責事項:
これは利益の保証ではなくツールです。過去のパフォーマンスは将来の結果を保証しません。常に適切なリスク管理を行い、まずはデモ口座で戦略をテストしてください。
概要
AIによる概要
ORB_Dashboard is a professional trading indicator for the cTrader platform designed to identify and trade Opening Range Breakouts (ORB) with dynamic risk management based on market volatility. It automatically detects the opening range period, calculates high/low boundaries watched by institutional traders, and visually extends these levels on the chart. The indicator confirms breakouts by requiring configurable consecutive closes beyond the range, reducing false signals and plotting trade entry arrows only upon confirmation.
Risk management adapts dynamically using the Average True Range (ATR) to set stop-loss and take-profit levels, adjusting for market volatility with customizable ATR multipliers and minimum stop distances. The dashboard provides real-time ATR values, color-coded profit and stop zones, risk-reward ratios, and tracks trade outcomes including duration and pips gained.
Key features include no repaint or redraw signals, one trade per opening range period to prevent over-trading, automatic trade outcome detection, and comprehensive visual trade management. The indicator is fully customizable for opening range hours, confirmation bars, ATR settings, and visual appearance. It supports all currency pairs and timeframes from 1 minute to daily, with low CPU usage and no external dependencies.
ORB_Dashboard suits swing traders, day traders, risk-averse traders, algorithmic traders, and educators seeking a refined ORB strategy with integrated volatility-based risk controls.
インジケーターのプロフィール
カスタマーレビュー
4.5
レビュー: 4
5 | 50 % | |
4 | 50 % | |
3 | 0 % | |
2 | 0 % | |
1 | 0 % |
カスタマーレビュー
February 16, 2026
ORB_Dashboard is a practical monitoring tool for Opening Range Breakout strategies. It works best from M10 up to H3, where OR logic remains relevant and actionable. Clean layout, stable performance and helpful for tracking multiple symbols without switching charts.
January 10, 2026
the idea is fine, just do not expect it to print perfect entries. It works better with a written plan.
December 30, 2025
December 30, 2025
The good surprise is the setup needs less second guessing. It should stay in the support stack.
ディスカッション
よくあるご質問
Signal
cTrader Storeで入手可能な取引ボット、インジケーター、プラグインなどの商品は、第三者の開発者が提供するものであり、情報と技術の取得のみを目的としてご利用いただけます。cTrader Storeはブローカーではなく、投資助言や個人的な推奨を行うことも、将来のパフォーマンスを保証することもありません。
この作成者の他の商品


価格
登録日 23/04/2025
2
販売