
説明
The UT Bot は、潜在的なトレンドの反転やモメンタムの変化を特定するための人気で高度にカスタマイズ可能なテクニカル分析インジケーターです。価格チャートに明確なエントリーおよびエグジットのシグナルを直接プロットすることで、取引の意思決定を簡素化するよう設計されています。
主な特徴と構成要素
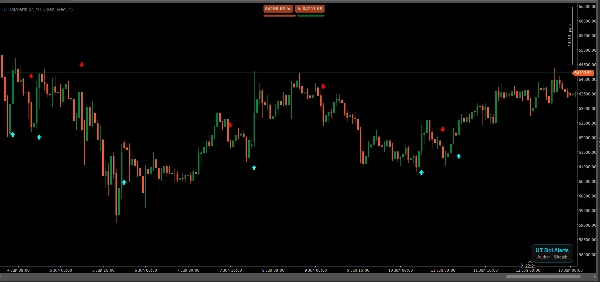
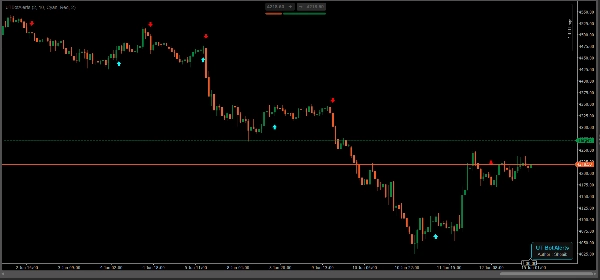
- 買いと売りのシグナル: インジケーターは 緑の「BUY」(上昇) 矢印と 赤の「SELL」(下降) 矢印をプロットし、潜在的なトレンドの変化を強調します。チャートに示されているように、市場の下落の始まりに売りシグナルが現れ、モメンタムが上昇に転じると買いシグナルが発動します。
- トレンド追跡: これはトレーダーが ダウントレンド(ベースラインの下で動く弱気の価格動向)と アップトレンド(上昇する強気の価格動向)を視覚的に区別するのに役立ちます。
- ローソク足との統合: シグナルは標準的なローソク足価格チャートにシームレスに重ねられ、ボットが発動する正確な価格レベルを簡単に確認できます。
- ボラティリティベースの感度: UT Botは通常、平均真の範囲(ATR)とトレーリングストップ機構の組み合わせに依存しており、トレーダーが感度を調整して市場のノイズを除去したり、長期的なトレンドを捉えたりできるようにしています。
概要
AIによる概要
UTBotAlerts is a technical analysis indicator designed to identify potential trend reversals and momentum shifts in financial markets. It visually signals buy and sell opportunities by plotting green "BUY" arrows and red "SELL" arrows directly on candlestick price charts, aiding traders in recognizing entry and exit points. The indicator distinguishes between uptrends and downtrends by tracking price action relative to a baseline, helping users interpret market direction clearly. UTBotAlerts incorporates volatility-based sensitivity adjustments using the Average True Range (ATR) combined with a trailing stop mechanism, allowing customization to filter market noise or capture longer-term trends. This indicator supports trend analysis and overlays seamlessly on standard price charts, enhancing decision-making through clear, actionable signals.
インジケーターのプロフィール
インジケーターのカテゴリー
トレンド
出力の種類
シグナル
データ要件
バーのみ
サポート対象のシグナル
トレンドの強さ
カスタマーレビュー
5.0
レビュー: 1
5 | 100 % | |
4 | 0 % | |
3 | 0 % | |
2 | 0 % | |
1 | 0 % |
カスタマーレビュー
June 29, 2026
UT Bot Alerts is a lightweight and stable implementation of the classic ATR-based trend reversal indicator. It provides clean BUY/SELL signals, adapts well to changing volatility conditions and works consistently across Forex and Gold markets. Its simplicity and reliability make it particularly useful as a trend filter or confirmation tool.
ディスカッション
よくあるご質問
Supertrend
Volume
ATR
cTrader Storeで入手可能な取引ボット、インジケーター、プラグインなどの商品は、第三者の開発者が提供するものであり、情報と技術の取得のみを目的としてご利用いただけます。cTrader Storeはブローカーではなく、投資助言や個人的な推奨を行うことも、将来のパフォーマンスを保証することもありません。


価格
登録日 04/09/2025
1
販売