
Liquidity Cluster Order
インジケーター
2 購入済
バージョン 1.0、Nov 2025
Windows、Mac
5.0
レビュー: 1
説明
流動性クラスターオーダー(LCO) 🔍💧
1. LCOが示すもの
流動性クラスターオーダー は自動的に検出し描画します:
- 強気の流動性クラスター(潜在的な需要/蓄積ゾーン)✅
- 弱気の流動性クラスター(潜在的な供給/分配ゾーン)🔻
各クラスターは:
- ボリュームピボットバーに基づいて固定されます(ボリュームの局所最大値)、
- 最近の価格の伸びに基づいて強気または弱気として分類され、
- 価格がクラスターを消化(消費)するまで時間的に前方へ拡張されます。
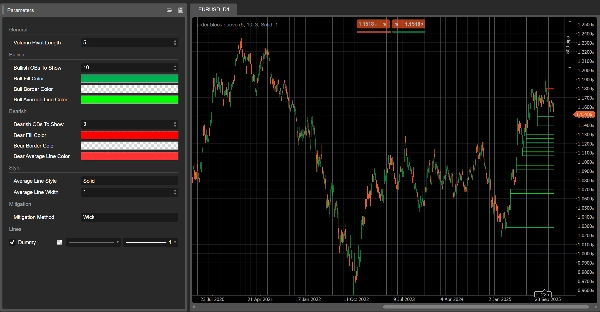
チャート上には以下が表示されます:
- 緑の長方形 → 強気の流動性クラスター
- 赤の長方形 → 弱気の流動性クラスター
- 各長方形内の灰色の線 → そのクラスターの平均価格レベル
クラスターが消化されたと判断されると、チャートから消え、アクティブなクラスターのみが残ります。
2. 検出ロジック(簡単に説明)
- ボリュームピボット
-
- LCOは、ボリュームが前後の
Volume Pivot Lengthバーより高いバーをスキャンします。 - これらのバーはボリュームピボットであり、流動性クラスターの潜在的なアンカーです。
- LCOは、ボリュームが前後の
- コンテキスト:強気対弱気
-
- 最近の価格動向がコンテキストを定義します:
-
- 強気コンテキスト → 下方向の伸びが支配的でした。
- 弱気コンテキスト → 上方向の伸びが支配的でした。
- このコンテキストにより、次のボリュームピボットが強気または弱気の流動性クラスターを作成するかが決まります。
- 強気の流動性クラスター
強気コンテキストでは: -
- クラスターの底 = ピボットバーの安値
- クラスターの上限 = バーの中間点(
(高値 + 安値) / 2) - 解釈:下方向の圧力が吸収され、買い手が積極的に介入したゾーン。
- 弱気の流動性クラスター
弱気コンテキストでは: -
- クラスターの底 = ピボットバーの中間点
- クラスターの上限 = ピボットバーの高値
- 解釈:上方向の圧力が吸収され、売り手が支配権を握ったゾーン。
- 平均線
-
- 各クラスターについて、LCOは上限と下限の平均を計算し、灰色の中間線を描画します。
- これはクラスターの内部均衡レベルとして機能します。
- 消化(クラスターの消費)
新しいバーごとに、LCOはクラスターが消化されたかをチェックします: -
- 強気クラスターの場合:
-
- 過去の
Volume Pivot Lengthバーにわたる下方向の目標価格を追跡します: -
Mitigation Method = Wick→ 最低の安値。Mitigation Method = Close→ 最低の終値。
- この目標価格がクラスターの底を下回ると、強気クラスターは消化されたと見なされ、削除されます。
- 過去の
- 弱気クラスターの場合:
-
- 上方向の目標価格を追跡します:
-
Wick→ 最高の高値。Close→ 最高の終値。
- この目標価格がクラスターの上限を上回ると、弱気クラスターは消化され削除されます。
消化された = そのクラスターの流動性は消費/無効化されたと想定されます。
3. チャート上でのLCOの読み方
主に以下が見られます:
- 価格の下にある緑のクラスター → 潜在的な需要流動性ゾーン
- 価格の上にある赤のクラスター → 潜在的な供給流動性ゾーン
典型的な読み方(取引アドバイスではありません):
- 新しいクラスター
-
- 最近作成されたクラスターはより関連性が高いことが多いです:
-
- 価格の下の強気クラスター → 買い手が最後に売り圧力を吸収したエリア。
- 価格の上の弱気クラスター → 売り手が最後に買い圧力を吸収したエリア。
- クラスターの再テスト
-
- 価格が上から強気クラスターに戻る場合:
-
- 価格が反応して底を維持すれば → 反発/ロングの反応ゾーンの可能性。
- 価格が下から弱気クラスターに戻る場合:
-
- 価格が上限を超えて取引できなければ → 拒否/ショートの反応ゾーンの可能性。
- 消化されたクラスターとアクティブなクラスター
-
- 価格が選択された消化方法に従ってクラスターの境界を突破すると、
→ その流動性クラスターは後続のバーで削除されます。 - まだ表示されているクラスターは、完全には取引されていないアクティブな流動性ゾーンです。
- 価格が選択された消化方法に従ってクラスターの境界を突破すると、
- 中間線の使用
-
- その灰色の中間線は以下として使用できます:
-
- クラスター内の利益確定または部分的な出口レベル、
- 流動性ゾーン内の「公正価格」の参照、
- 価格がクラスターの上半分か下半分かで取引されているかを素早く確認する方法。
4. パラメーター(英語)
Volume Pivot Length
- 以下に使用されるバー:
-
- ボリュームピボットの検出、
- 極値と消化目標の計算。
- 値が低いほど → クラスターが多く、ノイズも多い;
- 値が高いほど → クラスターは少なく、より重要。
表示する強気流動性クラスター
(旧称 表示する強気OB)
- チャートに表示される最大の強気クラスター数。
表示する弱気流動性クラスター
(旧称 表示する弱気OB)
- 表示される最大の弱気クラスター数。
強気/弱気の塗りつぶし色
- 強気/弱気クラスターの塗りつぶし色。
- アルファ(不透明度)値を含めることができます。
強気/弱気の平均線の色
- 各クラスターの内部中間線の色。
平均線のスタイル
- 中間線の視覚スタイル:
"Solid"、"Dashed"、"Dotted"。
平均線の幅
- 中間線の太さ。
消化方法
"Wick"→ 高値/安値のヒゲに基づく消化(より敏感)。"Close"→ 終値に基づく消化(より保守的)。
概要
AIによる概要
Liquidity Cluster Order (LCO) is a trading indicator that automatically identifies and visualizes key liquidity zones on price charts. It detects bullish liquidity clusters (potential demand or accumulation zones) and bearish liquidity clusters (potential supply or distribution zones) by anchoring each cluster on volume pivot bars—local volume maxima—and classifies them based on recent price extensions.
On the chart, bullish clusters appear as green rectangles below the price, indicating areas where buyers absorbed selling pressure. Bearish clusters are shown as red rectangles above the price, marking zones where sellers absorbed buying pressure. Each cluster includes a grey mid-line representing the average price level, serving as an internal equilibrium reference.
Clusters extend forward in time until price "mitigates" or consumes them, at which point they disappear, leaving only active liquidity zones visible. Mitigation is determined by tracking price extremes (high/low wicks or closing prices) over a configurable number of bars.
Key parameters include the volume pivot length (defining sensitivity and cluster significance), maximum clusters displayed, cluster colors, mid-line style, and mitigation method. LCO supports various markets including forex, indices, commodities, stocks, and cryptocurrencies, and integrates with multiple trading strategies and indicators such as RSI, MACD, Bollinger Bands, and Fibonacci levels.
インジケーターのプロフィール
カスタマーレビュー
5.0
レビュー: 1
5 | 100 % | |
4 | 0 % | |
3 | 0 % | |
2 | 0 % | |
1 | 0 % |
カスタマーレビュー
November 18, 2025
Two timeframes give more context. The first signal should not decide the only input.
ディスカッション
よくあるご質問
Signal
Indices
Commodities
GBPUSD
RSI
Bollinger
Fibonacci
Scalping
AI
XAUUSD
NAS100
MACD
BTCUSD
Forex
Breakout
EURUSD
NZDUSD
Martingale
Prop
Supertrend
Fair Value Gap
SMC
Crypto
Grid
Stocks
ATR
USDJPY
VWAP
cTrader Storeで入手可能な取引ボット、インジケーター、プラグインなどの商品は、第三者の開発者が提供するものであり、情報と技術の取得のみを目的としてご利用いただけます。cTrader Storeはブローカーではなく、投資助言や個人的な推奨を行うことも、将来のパフォーマンスを保証することもありません。


これも好きかも


![「[Stellar Strategies] Inside Bar with Signals」ロゴ](https://cdn.ctrader.com/image/webp/1d9e8bfa-3b2c-4440-bb37-5856902008a7_30683)


価格
42.11M
取引数量
6.13M
獲得pips
228
販売
8.48K
無料インストール