
Volume Delta
インジケーター
1.04K ダウンロード数
バージョン 1.0、Oct 2025
Windows、Mac
説明
マーケットプレイスピッチ(短縮版)
Volume Delta & CVD — リアルタイムでアグレッシブなフローを読み取ります。柔軟なリセット(日/週/月)、オプションの EMAスムージング、および再描画しない累積デルタ。ブレイクアウトの確認やダイバージェンスの発見に最適です。
Volume Delta & CVD — レビュー&パラメーターガイド
タグライン: 柔軟なリセットで買い/売りの不均衡(デルタ)とその累積フロー(CVD)を測定します。再描画なし。
概要
Volume Delta & CVD for cTraderは、バーごとにデルタ(アグレッシブな買い対売り)とCVD(累積ボリュームデルタ)を計算します。これにより、注文フロープレッシャーを読み取り、ブレイクアウトを確認し、価格に対するダイバージェンスを見つけるのに役立ちます。
注意:このインジケーターはボリュームの代理としてTickVolume(cTrader標準)を使用しています。
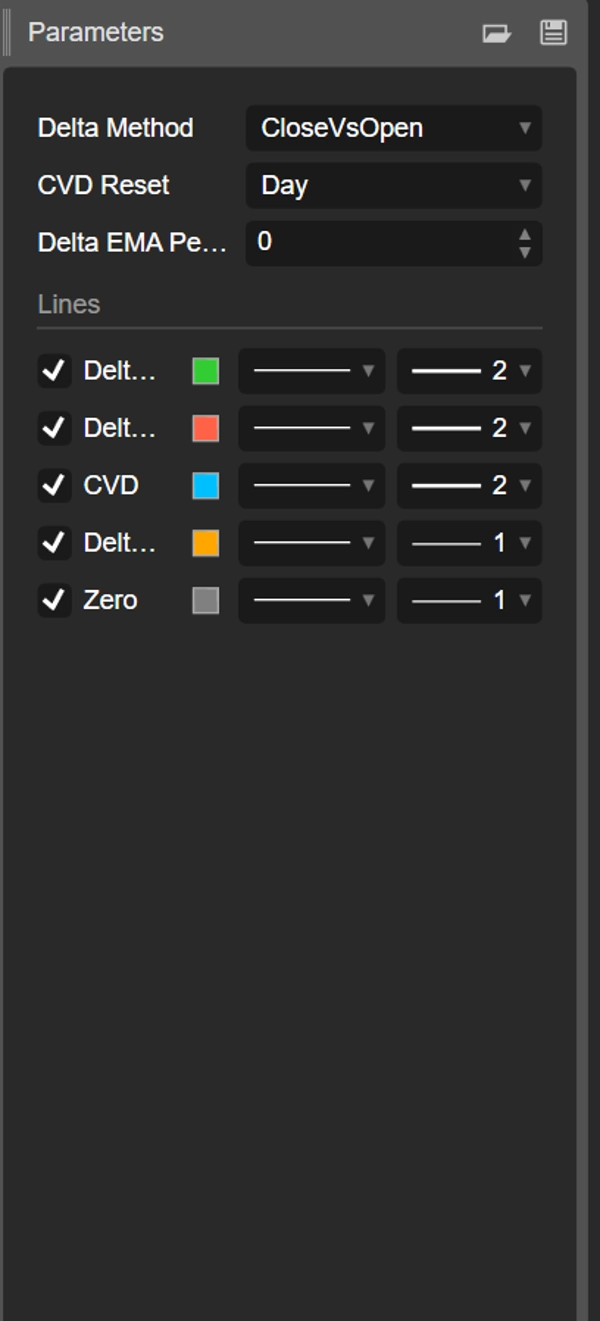
パラメーター(詳細)
デルタメソッド
バーの方向性フローの推定方法を選択します:
- CloseVsPrevClose
デルタ = ±TickVolume(Close[t] と Close[t-1] の比較による)。
利点: 非常に反応が良く、日中のレジームシフトに最適。 - CloseVsOpen
デルタ = ±TickVolume(同じバーの Close と Open の比較による)。
利点: 方向性のあるバーを強調し、バー間のノイズを減らす。 - マネーフローマルチプライヤー(MFM)
MFM = ((Close−Low) − (High−Close)) / (High−Low)の範囲は [−1, +1]
デルタ = MFM × TickVolume
利点: バー内の重み付け。レンジが広い場合に滑らかで堅牢。
CVDリセット
累積カウンターの再スタートのタイミングを制御します:
- なし: チャート開始から連続。
- 日: 各新しい日でリセット(イントラデイバイアス)。
- 週: 各新しい週でリセット(スイング)。
- 月: 各新しい月でリセット(高タイムフレームバイアス)。
デルタEMA期間(0 = オフ)
- デルタにEMAを適用し、ヒストグラムを滑らかにしてレジーム変化を明らかにします。
- 推奨値: 5–9 スキャルピング、10–21 イントラデイ、21–34 スイング。
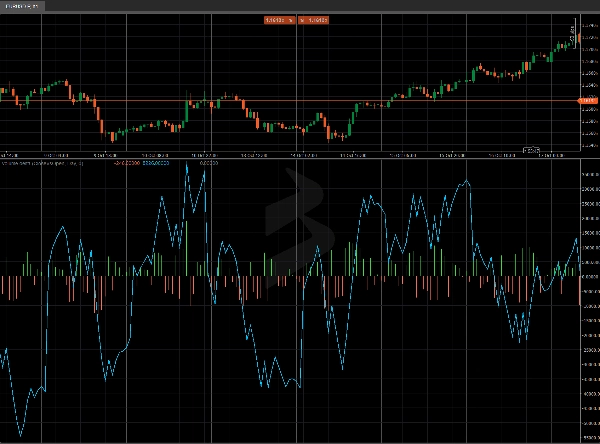
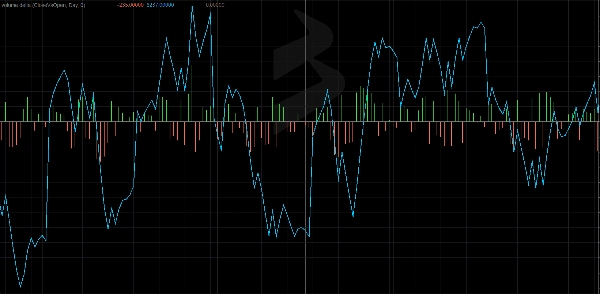
出力 / バッファ
- デルタアップ(緑のヒストグラム):正のデルタ部分。
- デルタダウン(赤のヒストグラム):負のデルタ部分。
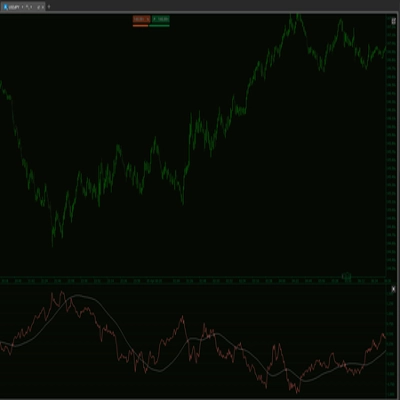
- CVD(アクアライン):選択したリセットでのデルタの累積和。
- デルタEMA(オレンジライン、オプション):滑らかにしたデルタ。
- ゼロ(グレーライン):迅速な比較のための基準線。
読み方
- デルタ > 0 → バー内でアグレッシブな買いの優勢。
- デルタ < 0 → バー内でアグレッシブな売りの優勢。
- CVD上昇 → 蓄積;CVD下降 → 分配。
- ダイバージェンス
-
- 価格が高値更新する一方で、CVDが確認できない → 買い圧力の枯渇の可能性。
- 価格が安値更新する一方で、CVDが確認できない → 売り圧力の枯渇の可能性。
実用的なプレイブック
- ブレイクアウト確認: CVDが加速し、デルタEMAが正に転じたときにロングブレイクアウトを好みます。
- エクステンションのフェード: 重要なレベル(VWAP/アンカードVWAP、S/R)での価格とCVDのダイバージェンスを探します。
- セッションバイアス: CVDリセット = 日の場合、支配的な日中の方向性を読み取ります。
クイックスタート
- インジケーターをアタッチします。
- まずは デルタメソッド = MFM、CVDリセット = 日、EMA = 10(イントラデイ)で開始します。
- ノイズの多いチャートでは、EMAを増やすか、CloseVsOpenに切り替えます。
- アンカードVWAP、静的/動的S/R、またはプライスアクションパターンとの合流を探します。
パフォーマンスと互換性
- モダンAPI(
Bars.*、LineColor)。 - 再描画しない計算。
- 任意のシンボルとタイムフレームで動作。
概要
AIによる概要
Volume Delta & CVD is an indicator for cTrader designed to measure aggressive buying and selling pressure in real time by calculating the Delta (buy/sell imbalance) and its cumulative sum (Cumulative Volume Delta, CVD) per bar. It uses TickVolume as a volume proxy and offers flexible reset options for the cumulative counter, including none, daily, weekly, or monthly resets, allowing users to tailor the indicator to different trading timeframes.
The indicator supports three Delta calculation methods: CloseVsPrevClose (responsive for intraday shifts), CloseVsOpen (reduces noise by focusing on directional bars), and Money Flow Multiplier (MFM) which weights intra-bar volume for smoother results. An optional Exponential Moving Average (EMA) smoothing can be applied to Delta to highlight regime changes.
Outputs include separate histograms for positive and negative Delta, the CVD line, an optional Delta EMA line, and a zero baseline for reference. Traders can use the indicator to confirm breakouts, identify divergences between price and volume flow, and assess order-flow pressure. It works on any symbol and timeframe, supporting markets such as Forex, indices, commodities, stocks, and cryptocurrencies.
インジケーターのプロフィール
カスタマーレビュー
0.0
レビュー: 0
カスタマーレビュー
この商品にはまだレビューがありません。お使いになったことがある方は、ぜひレビューをお願いします。
ディスカッション
よくあるご質問
Signal
Indices
Commodities
GBPUSD
RSI
Bollinger
Fibonacci
Scalping
AI
XAUUSD
NAS100
MACD
BTCUSD
Forex
Breakout
EURUSD
NZDUSD
Martingale
Prop
ZigZag
Supertrend
Fair Value Gap
SMC
Crypto
Grid
Stocks
ATR
USDJPY
VWAP
cTrader Storeで入手可能な取引ボット、インジケーター、プラグインなどの商品は、第三者の開発者が提供するものであり、情報と技術の取得のみを目的としてご利用いただけます。cTrader Storeはブローカーではなく、投資助言や個人的な推奨を行うことも、将来のパフォーマンスを保証することもありません。


これも好きかも


価格
42.11M
取引数量
6.13M
獲得pips
221
販売
8.34K
無料インストール