
Rsi buy Sell Signal
Chỉ báo
335 lượt tải
Phiên bản 1.0, Aug 2025
Windows, Mac
4.0
Đánh giá: 1
Mô tả
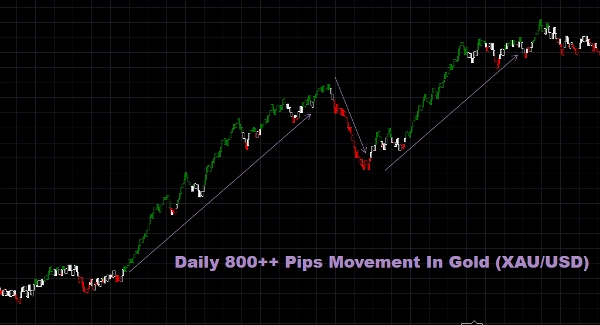
Nâng cao kỹ năng scalping của bạn với RSI Scalping. Phân tích RSI của nó kích hoạt các giao dịch nhanh trên các chỉ số và cặp forex biến động, trong khi quản lý thoát động giúp khóa lợi nhuận nhanh chóng. Với các điều khiển trực quan, nó hoàn hảo cho cả người mới và các scalper có kinh nghiệm.
Tóm tắt
Tóm tắt AI
RSI Buy Sell Signal is an indicator designed for scalping in volatile markets, specifically targeting turbulent indexes and forex pairs. It uses Relative Strength Index (RSI) analysis to generate rapid trade signals, enabling quick entry and exit decisions. The indicator features dynamic exit management to help secure profits efficiently. Its intuitive controls make it accessible for both novice and experienced scalpers. This tool is intended to support fast-paced trading strategies by providing timely buy and sell signals based on RSI movements.
Hồ sơ chỉ báo
Đánh giá của khách hàng
4.0
Đánh giá: 1
5 | 0 % | |
4 | 100 % | |
3 | 0 % | |
2 | 0 % | |
1 | 0 % |
Đánh giá của khách hàng
Thảo luận
Câu hỏi thường gặp
Các sản phẩm có sẵn trên cTrader Store, bao gồm bot giao dịch, chỉ báo và plugin, được cung cấp bởi các nhà phát triển bên thứ ba và chỉ nhằm mục đích cung cấp thông tin và tiếp cận kỹ thuật. cTrader Store không phải là nhà môi giới và không cung cấp lời khuyên đầu tư, khuyến nghị cá nhân hay bất kỳ đảm bảo nào về hiệu suất trong tương lai.


Giá
Kể từ 03/08/2025
335
Cài đặt miễn phí