
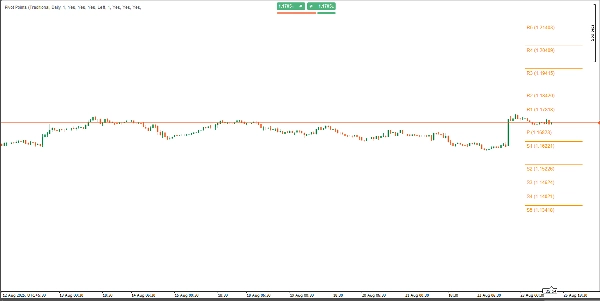
Pivot Point Daily Indicator
Indicateur
14 achats
Version 2.0, May 2026
Windows, Mac
4.2
Avis : 4
Description
Caractéristiques principales :
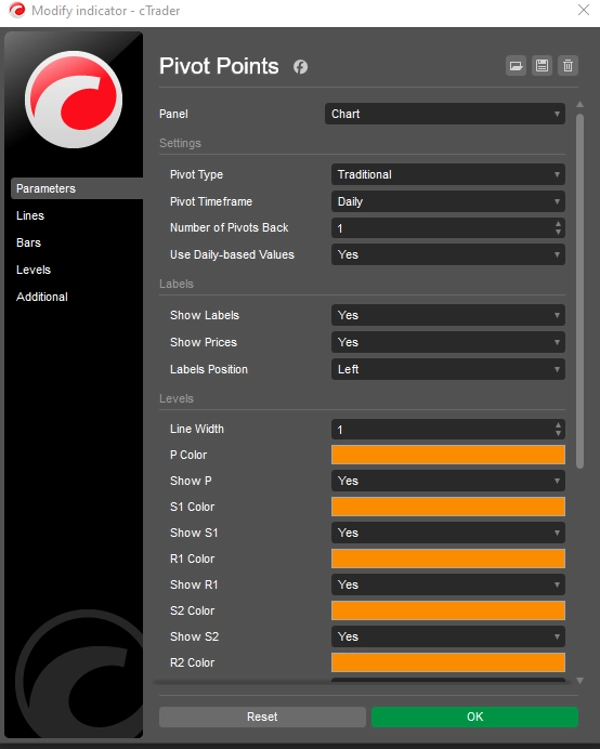
- Styles de pivot multiples : Passez facilement entre six méthodes de calcul des pivots : Classique, Fibonacci, Woodie, Camarilla, DM et Traditionnel. Chaque méthode prend en charge différents niveaux (jusqu'à R5/S5 pour Traditionnel et Camarilla, R3/S3 pour Fibonacci, et P/R1/S1 pour DM).
- Périodes flexibles : Choisissez parmi une large gamme de périodes de pivot, y compris Auto, Quotidien, Hebdomadaire, Mensuel, Trimestriel, Annuel, et options pluriannuelles (Biannuel, Triennal, Quinquennal, Décennal). Parfait pour s'aligner avec votre horizon de trading.
- Contrôle des pivots historiques : Définissez le nombre d'ensembles de pivots historiques à afficher (1–200) avec le paramètre Nombre de pivots en arrière, garantissant un graphique épuré tout en conservant les niveaux historiques clés.
- Apparence personnalisable : Couleurs, largeurs de ligne et paramètres d'étiquette entièrement ajustables. Activez ou désactivez les étiquettes et les valeurs de prix, et choisissez la position des étiquettes (Gauche ou Droite) avec des décalages verticaux intelligents pour plus de clarté.
- Données quotidiennes ou intrajournalières : Option d'utiliser des valeurs basées sur le quotidien ou les données de la période du graphique, offrant une flexibilité pour différentes stratégies de trading.
- Performance optimisée : Code natif cTrader léger assurant des mises à jour rapides en temps réel sans latence, compatible avec Forex, indices, matières premières, crypto, et plus encore.
Pourquoi choisir Pivot Points Standard ?
- Outil de trading polyvalent : Identifiez les niveaux clés de support/résistance, les directions de tendance et les opportunités de rupture sur n'importe quel marché ou période.
- Interface conviviale : Des menus déroulants intuitifs pour le type de pivot, la période et la position des étiquettes facilitent la personnalisation.
- Analyse historique : Visualisez jusqu'à 200 ensembles de pivots historiques pour étudier les interactions passées des prix et affiner votre stratégie.
- Graphiques épurés : Positionnement intelligent des étiquettes et longueurs de ligne personnalisables évitent l'encombrement du graphique, améliorant la lisibilité.
Comment utiliser :
- Appliquez l'indicateur à votre graphique cTrader.
- Sélectionnez votre type de pivot préféré (par exemple, Fibonacci, Camarilla) et la période du pivot (par exemple, Quotidien, Mensuel).
- Ajustez le nombre de pivots en arrière pour contrôler les ensembles historiques affichés.
- Personnalisez les couleurs, largeurs de ligne et paramètres d'étiquette selon votre style.
- Utilisez les niveaux de pivot pour identifier support/résistance, définir stop-loss/take-profit, ou trader les ruptures.
Idéal pour :
- Day Traders : Exploitez les pivots quotidiens ou hebdomadaires pour des entrées et sorties intrajournalières.
- Swing Traders : Utilisez les pivots mensuels ou trimestriels pour capter les tendances à plus long terme.
- Scalpers : Combinez avec des périodes plus courtes pour des trades rapides et précis.
- Tous les marchés : Fonctionne parfaitement sur Forex, actions, crypto et matières premières.
Boostez votre confiance en trading
Avec Pivot Points Standard, vous accédez à un outil puissant tout-en-un qui simplifie l'analyse technique et améliore votre capacité à repérer des opportunités de trading à haute probabilité. Que vous soyez débutant ou trader expérimenté, cet indicateur s'adapte à votre stratégie, fournissant des niveaux clairs et exploitables pour élever votre trading. Essayez Pivot Points Standard dès aujourd'hui et prenez le contrôle de votre trading avec précision et clarté ! Paiement unique. Accès à vie. Mises à jour futures incluses.
Résumé
Résumé IA
Pivot Point Daily Indicator is a multi-timeframe pivot point tool designed for the cTrader platform. It supports six pivot calculation methods—Classic, Fibonacci, Woodie, Camarilla, DM, and Traditional—each offering various resistance and support levels (up to R5/S5 for some methods). Users can select from a broad range of timeframes including Auto, Daily, Weekly, Monthly, Quarterly, Yearly, and multi-year intervals, allowing alignment with different trading horizons.
The indicator allows displaying up to 200 historical pivot sets to analyze past price interactions while maintaining chart clarity through customizable label positions and line settings. It offers options to use daily-based or intraday data, enhancing flexibility for diverse trading strategies.
Pivot Point Daily Indicator is optimized for real-time performance with native cTrader coding, compatible across Forex, indices, commodities, cryptocurrencies, and other markets. Its interface includes intuitive dropdown menus for pivot type, timeframe, and label customization.
Traders can use this indicator to identify key support and resistance levels, trend directions, and breakout opportunities, aiding in setting stop-loss and take-profit points. It suits various trading styles including day trading, swing trading, and scalping across multiple asset classes.
Profil de l'indicateur
Catégorie de l'indicateur
Assistance et résistance
Type de résultat
Filtre
Exigences en matière de données
Barres seulement
Signaux pris en charge
Dépassement de niveau
Avis clients
4.2
Avis : 4
5 | 25 % | |
4 | 75 % | |
3 | 0 % | |
2 | 0 % | |
1 | 0 % |
Avis clients
May 2, 2026
Bought it, added it, used it for a while, and now it's disappeared, and I cannot get it back!
August 28, 2025
Good helper for review if the trader wants it keeps attention on levels that actually matter. It works best as support, not a final decision maker. The cleanest use is 3 to 5 levels per chart, with 0.5 pullbacks checked before entry. not every zone holds, even if it looks clean.
August 27, 2025
August 27, 2025
Usable tool with purpose for traders who build plans around market levels. It gives value around key price zones, but not every zone holds, even if it looks clean. I would wait for 2 reactions and avoid trades where the target is less than 1.5R. Levels are useful when they reduce noise, not when they crowd the chart.
Discussion
Questions fréquentes
Fibonacci
Prop
Forex
Breakout
Indices
Commodities
Les produits disponibles sur cTrader Store, notamment les bots de trading, les indicateurs et les plug-ins, sont fournis par des développeurs tiers et mis à disposition à titre informatif et à des fins d'accès technique uniquement. cTrader Store n'est pas un courtier et ne fournit aucun conseil en investissement, aucune recommandation personnelle ni aucune garantie quant aux performances futures.


Prix
Depuis le 30/05/2025
40
Ventes