
session indicator
Indicateur
7 achats
Version 1.0, May 2025
Windows, Mac
4.3
Avis : 3
Description
Visualisez les principales sessions de marché + les niveaux Haut/Bas avec précision
L'indicateur des sessions de trading met en évidence les sessions de trading les plus importantes — London, New York, et Tokyo — directement sur votre graphique. Que vous soyez scalpeur ou swing trader, savoir quand la volatilité augmente ou diminue est crucial. Cet outil vous offre cet avantage avec clarté.
✅ Fonctionnalités clés :
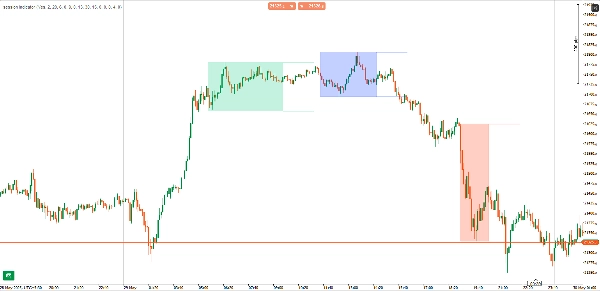
- Rectangles de session : Mettez en évidence visuellement chaque session avec des cases ombrées optionnelles
- Lignes Haut/Bas : Tracez les hauts et bas de session avec une longueur d'extension personnalisable
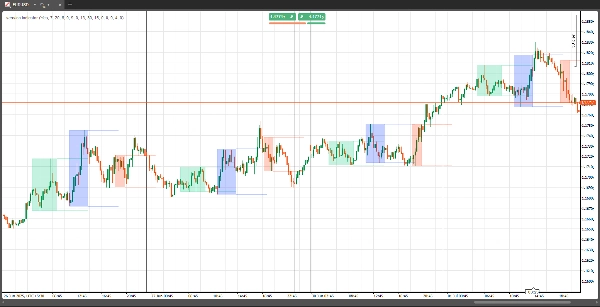
- Vue historique : Consultez les données de session pour le jour en cours ou pour un nombre quelconque de jours précédents
- Entièrement personnalisable : Définissez les heures de début/fin de session, activez/désactivez les rectangles, et définissez jusqu'où les lignes s'étendent
- Support multi-échelles temporelles : Fonctionne sur toutes les échelles temporelles du graphique
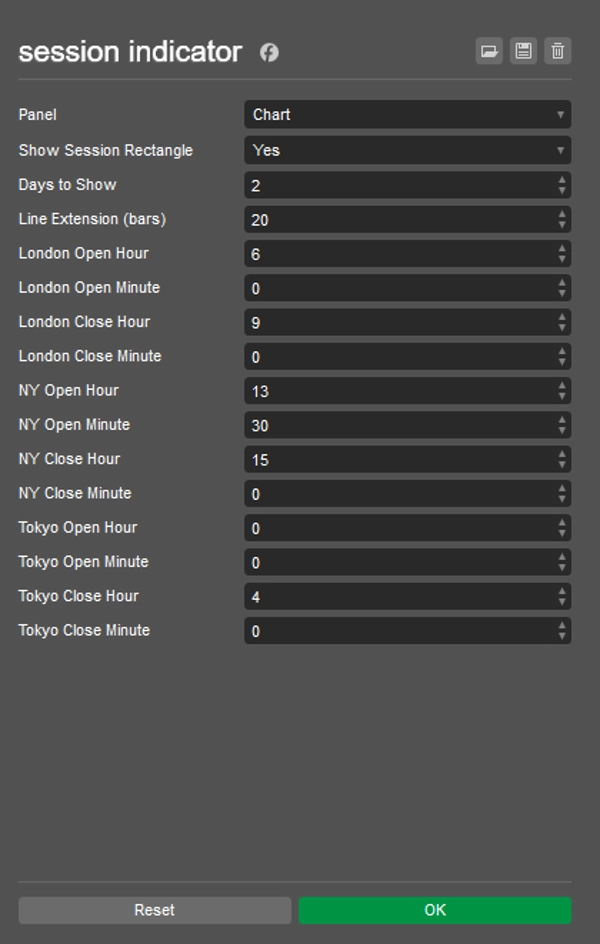
🔧 Paramètres :
- Heures de session : Heure de début/fin personnalisée pour London, NY, et Tokyo
- Afficher le rectangle : Activez ou désactivez les cases ombrées de session
- Jours à afficher : Nombre de jours historiques pour afficher les données de session
- Barres d'extension de ligne : Contrôlez jusqu'où les lignes haut/bas de session s'étendent sur le graphique
🧠 Pourquoi l'utiliser ?
Comprendre les modèles de volatilité basés sur les sessions est une pierre angulaire du trading institutionnel. Cet indicateur vous aide à :
- Synchroniser les entrées et sorties autour des zones clés de liquidité
- Identifier les hauts et bas de session pour les stratégies de cassure ou de retournement
- Séparer visuellement les chevauchements de session (par ex., London–NY)
Résumé
Résumé IA
The Session Indicator is a charting tool designed to highlight key global trading sessions—London, New York, and Tokyo—directly on trading charts. It visually marks each session with optional shaded rectangles and plots session high and low price levels, with customizable line extension lengths. Users can view session data for the current day or multiple previous days, supporting analysis across various timeframes.
Key features include full customization of session start and end times, toggling of session rectangles, and control over how far high/low lines extend. The indicator works on all chart timeframes and helps traders identify volatility patterns associated with institutional trading sessions.
This tool aids in timing entries and exits around key liquidity zones, recognizing session highs and lows for breakout or reversal strategies, and visually distinguishing overlapping sessions such as London-New York. It supports markets including Forex, indices, and major symbols like NAS100. The indicator outputs visual signals based on market structure concepts and is suitable for traders employing reversal strategies.
Profil de l'indicateur
Catégorie de l'indicateur
Structure du marché (SMC)
Type de résultat
Visualisation
Exigences en matière de données
Barres seulement
Signaux pris en charge
Inversion
Avis clients
4.3
Avis : 3
5 | 67 % | |
4 | 0 % | |
3 | 33 % | |
2 | 0 % | |
1 | 0 % |
Avis clients
June 2, 2025
Useful setup helper for traders who care about timing windows. It gives value around session timing, but the value depends on the trader's schedule. I would compare Asia range, London break and New York continuation before trusting it. The tool is most useful when it keeps the trader out of dead hours.
June 1, 2025
June 1, 2025
Decent trade support for session timing. it helps match setups with active market hours, especially when used for planning trades around active sessions. The session view is useful for London and New York, especially when checking the first 60 minutes. The tool is most useful when it keeps the trader out of dead hours.
Discussion
Questions fréquentes
Prop
Forex
Indices
Fair Value Gap
SMC
NAS100
Les produits disponibles sur cTrader Store, notamment les bots de trading, les indicateurs et les plug-ins, sont fournis par des développeurs tiers et mis à disposition à titre informatif et à des fins d'accès technique uniquement. cTrader Store n'est pas un courtier et ne fournit aucun conseil en investissement, aucune recommandation personnelle ni aucune garantie quant aux performances futures.


![Logo de "[Hamster-Coder] Bollinger Bands"](https://cdn.ctrader.com/image/webp/21d8e5d6-fb11-4bac-b9ee-cd05c2b76804_30327)


Prix
Depuis le 30/05/2025
40
Ventes