
support and resistance
Indicateur
13 achats
Version 1.0, Jun 2025
Windows, Mac
4.3
Avis : 3
Description
Caractéristiques principales :
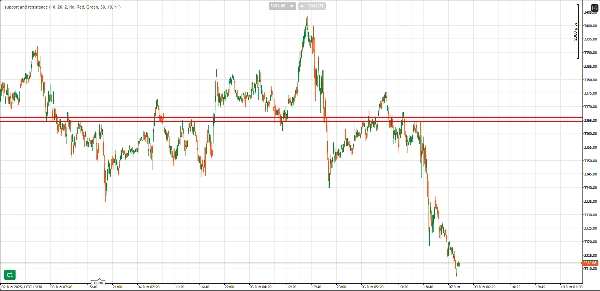
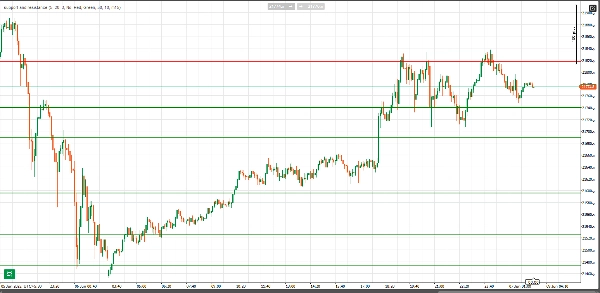
- Détection automatique des supports et résistances : L'indicateur identifie automatiquement les niveaux significatifs de support et de résistance basés sur l'action des prix, mettant en évidence ces zones où le prix s'est inversé ou est resté bloqué plusieurs fois.
- Validation par comptage des rebonds : Les niveaux de support et de résistance sont validés en fonction du nombre de rebonds (réactions du prix) depuis le niveau. Plus il y a de rebonds, plus le niveau est fort. Vous pouvez ajuster le nombre minimum de rebonds pour qu'un niveau soit considéré comme valide, garantissant que seuls les niveaux très significatifs sont marqués.
- Styles de lignes ajustables : L'épaisseur et le style des lignes de support et de résistance sont automatiquement ajustés en fonction du nombre de rebonds. Les niveaux avec plus de rebonds sont tracés avec des lignes plus épaisses et plus visibles, soulignant visuellement leur importance.
- Largeur de la zone (pips) : Vous pouvez définir une zone tampon autour des niveaux de support et de résistance en pips. Cela aide à identifier l'action des prix dans une plage où le prix pourrait potentiellement se retourner ou réagir.
- Filtre de timeframe supérieur : Une caractéristique unique de cet indicateur est sa capacité à valider les niveaux de support et de résistance en utilisant un filtre de timeframe supérieur. En sélectionnant un timeframe supérieur (par exemple, 1H, 4H), l'indicateur recoupe les niveaux identifiés avec l'action clé des prix sur le timeframe supérieur, garantissant que seuls les niveaux significatifs sont tracés sur le graphique.
- Alertes : Lorsque le prix entre dans la zone d'un niveau de support ou de résistance, l'indicateur peut vous alerter par un son audio, pour que vous ne manquiez jamais une réaction importante du prix.
- Couleurs personnalisables : Vous pouvez facilement changer la couleur des lignes de support et de résistance pour correspondre à vos préférences ou à votre thème de trading.
- Prévention des chevauchements : L'indicateur inclut un filtre de seuil qui empêche le tracé de niveaux de support et de résistance qui se chevauchent et sont trop proches les uns des autres, garantissant que seuls des niveaux uniques et importants sont affichés.
Avantages :
- Gagnez du temps : Détectez et visualisez automatiquement les niveaux clés de support et de résistance sans les dessiner manuellement.
- Visuels clairs : Voyez facilement quels niveaux de support et de résistance sont les plus significatifs en fonction des rebonds de prix et de la validation sur un timeframe supérieur.
- Alertes efficaces : Recevez des alertes en temps utile lorsque l'action des prix atteint des niveaux importants, vous aidant à agir rapidement et efficacement.
- Décisions de trading améliorées : Utilisez cet indicateur pour gagner en confiance dans vos entrées et sorties, ainsi que dans votre analyse technique globale.
Options de personnalisation :
- Barres de retour : Ajustez la profondeur de l'historique que l'indicateur analyse pour identifier les niveaux potentiels de support et de résistance.
- Nombre minimum de rebonds : Définissez le nombre minimum de rebonds requis pour qu'un niveau soit considéré comme valide.
- Timeframe supérieur : Filtrez les niveaux de support et de résistance en fonction d'un timeframe supérieur (par exemple, graphiques 1 heure, 4 heures).
- Couleur des lignes : Choisissez les couleurs des lignes de résistance et de support pour correspondre à votre style de graphique.
- Paramètres d'alerte : Activez ou désactivez les alertes en fonction de l'entrée du prix dans les zones de support ou de résistance.
Résumé
Résumé IA
This indicator automatically detects key support and resistance levels by analyzing price action and identifying zones where price has reversed or stalled multiple times. It validates these levels based on the number of price bounces, allowing users to set a minimum bounce count to highlight only significant levels. The indicator visually emphasizes stronger levels by adjusting line thickness and style according to bounce count. Users can define a buffer zone around levels in pips to capture price reactions within a range.
A higher timeframe filter cross-checks identified levels against price action on selected higher timeframes (e.g., 1-hour, 4-hour), ensuring only important levels are displayed. Alerts notify users with audio signals when price enters support or resistance zones. The indicator prevents overlapping lines by applying a threshold filter, maintaining clarity on the chart. Colors of support and resistance lines are customizable to fit user preferences.
Customization options include adjusting lookback bars, minimum bounces, higher timeframe selection, line colors, and alert settings. This tool supports markets such as Forex, commodities, indices, and popular symbols including BTCUSD, EURUSD, GBPUSD, XAUUSD, NAS100, and USDJPY. It aids traders in saving time, improving visual clarity, receiving timely alerts, and making more confident trading decisions.
Profil de l'indicateur
Catégorie de l'indicateur
Assistance et résistance
Type de résultat
Visualisation
Exigences en matière de données
Barres seulement
Signaux pris en charge
Cassure
Inversion
Avis clients
4.3
Avis : 3
5 | 33 % | |
4 | 67 % | |
3 | 0 % | |
2 | 0 % | |
1 | 0 % |
Avis clients
June 11, 2025
Nice setup companion for a more controlled workflow. It helps with planning entries and exits around important areas, but not every zone holds, even if it looks clean. The cleanest use is 3 to 5 levels per chart, with 0.5 pullbacks checked before entry. I would still keep manual review in the process.
June 10, 2025
June 10, 2025
Decent option for checks around key price zones. The useful part is planning entries and exits around important areas, with the numbers checked before scaling. I would wait for 2 reactions and avoid trades where the target is less than 1.5R. Levels are useful when they reduce noise, not when they crowd the chart.
Discussion
Questions fréquentes
BTCUSD
Prop
Forex
Breakout
Indices
EURUSD
Commodities
GBPUSD
NZDUSD
XAUUSD
NAS100
USDJPY
Les produits disponibles sur cTrader Store, notamment les bots de trading, les indicateurs et les plug-ins, sont fournis par des développeurs tiers et mis à disposition à titre informatif et à des fins d'accès technique uniquement. cTrader Store n'est pas un courtier et ne fournit aucun conseil en investissement, aucune recommandation personnelle ni aucune garantie quant aux performances futures.


Prix
Depuis le 30/05/2025
40
Ventes