
Description
📈 Cet indicateur est un outil qui nous aide à identifier et visualiser la direction de la tendance dans un graphique de prix. 📊 Son fonctionnement repose sur le calcul des niveaux de tendance à l'aide de moyennes mobiles exponentielles et d'une mesure de la volatilité pour déterminer les zones où le prix est censé évoluer. Ci-dessous, j'expliquerai en détail comment il fonctionne :
📐 Calcul des niveaux de tendance
L'indicateur commence par calculer ce qu'on appelle le « niveau de base ». Ce niveau est obtenu en faisant la moyenne de deux moyennes mobiles exponentielles : une à court terme (basée sur une longueur définie par l'utilisateur, dans ce cas, 222) et une à long terme (le double de la longueur de la première). Ces moyennes nous donnent une référence pour la tendance globale.
Ensuite, la volatilité est calculée en utilisant l'écart-type des prix de clôture, et cette valeur est lissée avec une moyenne mobile exponentielle supplémentaire. La volatilité lissée est multipliée par un paramètre appelé « sensibilité », ce qui nous donne les niveaux supérieur et inférieur autour du niveau de base. Ces niveaux agissent comme des bandes de tendance et aident à identifier si le prix est au-dessus ou en dessous de la tendance.
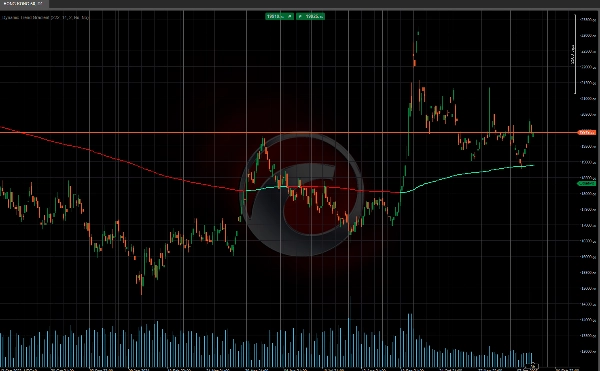
📉📈 État de la tendance
Avec ces niveaux calculés, l'indicateur évalue l'état de la tendance sur le marché. Si le prix est au-dessus du niveau de base, il suppose une tendance haussière 🐂, et s'il est en dessous, la tendance est baissière 🐻. Si le prix franchit les niveaux supérieur ou inférieur, l'indicateur change son signal de tendance, indiquant un possible renversement ou un changement dans le momentum du marché.
Cet outil est parfait pour les traders cherchant à anticiper les tendances du marché ! 🚀📉📈
Indicateurs du Ctrader Store :
Dynamic Market Structure
Analyse des points de retournement
Fibonacci Linear
Régression multi-échelle
Multi-Level Candle Bias
Tracker
Auto Support and
Resistance Trend Lines
Résumé
Avis clients
5 | 0 % | |
4 | 100 % | |
3 | 0 % | |
2 | 0 % | |
1 | 0 % |


