Opis
Wskaźniki Pinescriptlabs Store: Pinescriptlabs Store cBots : (cBot) Gold & BTC BreakoutSession Pivots(nowy)
PRICE ACTION (Nowy)
Prognoza na podstawie Linreg & ATR
SmartTrend Wsparcie &
Opór
Linie
Dynamiczna
Struktura Rynku
Analiza
punktów
zwrotnych
Punktów
Fibonacci
Regresja
Liniowa
Wielookresowa
Momentum Luka Wartości Rynkowej
Wielopoziomowy
Śledzenie Kierunku Świec
Tracker
Automatyczne
Wsparcie i
Opór
Linie
Trendu
Wszystkie
Poziomy
Wsparcia i
Opory
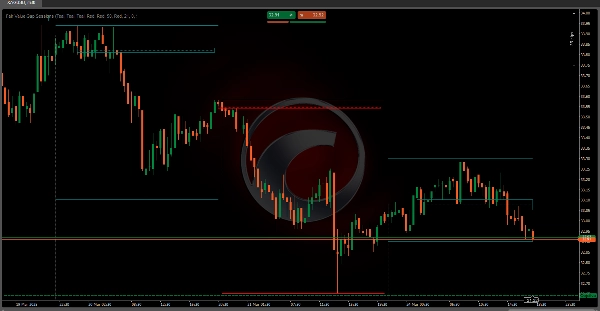
Sesje Luka Wartości Rynkowej 📊💰
Wskaźnik Luka Wartości Rynkowej (FVG) to zaawansowane narzędzie handlowe zaprojektowane do identyfikacji i podkreślania tymczasowych nieefektywności rynku znanych jako "luki wartości rynkowej" 🚨 w określonych sesjach handlowych. Te luki reprezentują momenty, w których cena rynkowa porusza się szybko ⚡, tworząc nierównowagę między kupującymi a sprzedającymi.
Kluczowe Mechanizmy Techniczne 🔧
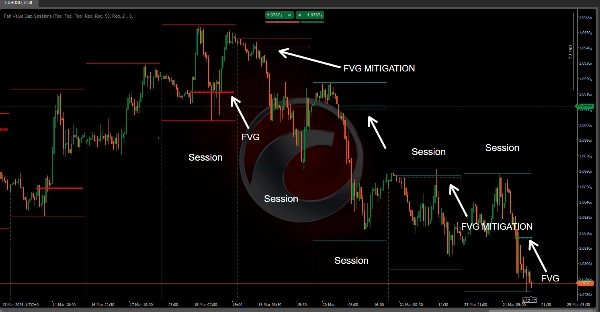
Architektura oparta na sesjach 🕒
• Wdraża precyzyjne, konfigurowalne podejście analizy oparte na sesjach
• Pozwala traderom definiować niestandardowe godziny rozpoczęcia sesji z obsługą czasu UTC lub lokalnego 🌍
• Tworzy dynamiczną granicę sesji, która resetuje się i śledzi zachowanie rynku 🔄
Logika wykrywania luki wartości rynkowej 🔎
• Wykorzystuje zaawansowaną analizę price action na wielu kolejnych świecach cenowych
• Identyfikuje luki poprzez porównanie:
o Maksymalnych i minimalnych cen kolejnych świec 📈📉
o Ceny zamknięcia poprzedniej świecy ✅
o Struktury cenowej bieżącej świecy 🔄
Klasyfikacja luk 🏷️
Wskaźnik rozróżnia dwa podstawowe typy luk:
- Bycza Luka Wartości Rynkowej 📈
o Występuje, gdy cena przeskakuje powyżej poprzedniego maksimum 🔺
o Wskazuje na potencjalny wzrostowy impet rynku 🚀
o Sygnał możliwego nacisku kupujących 💸 - Niedźwiedzia Luka Wartości Rynkowej 📉
o Występuje, gdy cena spada poniżej poprzedniego minimum 🔻
o Sugeruje potencjalny spadkowy impet rynku ⬇️
o Sygnał możliwego nacisku sprzedających 🛑
Zastosowania handlowe 📱💼
Strategiczne Wskazówki 💡
• Pomaga traderom wizualizować nieefektywności rynku 🖼️
• Dostarcza wczesne ostrzeżenia o potencjalnych odwróceniach trendu ⚠️
• Oferuje precyzyjną identyfikację punktów wejścia i wyjścia 🎯
Funkcje zarządzania ryzykiem 🛡️
• Wizualizacja stanów luki kodowana kolorami 🎨
• Śledzi "łagodzenie" luki (gdy cena wraca do strefy luki) ↔️
• Pozwala na konfigurowalne ustawienia kolorów dla różnych warunków rynkowych 🎨
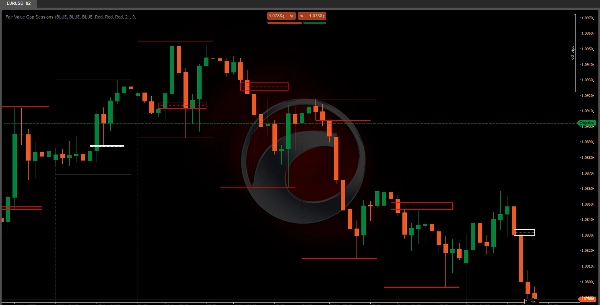
Wizualizacja techniczna 🎨
Wskaźnik tworzy dwa podstawowe elementy wizualne:
- Prostokąt Obszaru Luki 🟩
o Reprezentuje zakres cenowy zidentyfikowanej luki 📐
o Dynamicznie rozszerza się przez całą sesję handlową ➡️
o Zmienia kolor w zależności od statusu luki (aktywna/załagodzona) 🟩➡️🟨 - Linia Poziomu 📏
o Umieszczona na środku luki ⚫
o Pomaga traderom szybko zidentyfikować centralną strefę cenową luki 📍
o Używa różnych stylów linii do wskazania stanu luki ➔
Praktyczne strategie handlowe 📝
Strategie sygnału wejścia 🚦
• Używaj wykrywania luki jako potencjalnego sygnału kontynuacji trendu 🔄
• Szukaj powrotu ceny do luki (łagodzenia) jako potwierdzenia ✅
• Łącz z innymi wskaźnikami technicznymi dla solidnego podejmowania decyzji 🤝
Techniki zarządzania ryzykiem 🛡️
• Ustaw stop-loss blisko granic luki ⛔
• Używaj środka luki jako potencjalnego poziomu wsparcia/oporu 🪜
• Monitoruj łagodzenie luki jako potencjalny wskaźnik odwrócenia trendu ↔️⚠️
Elastyczność konfiguracji ⚙️
• Konfigurowalny czas rozpoczęcia sesji ⏰
• Konfiguracja strefy czasowej (UTC/Lokalna) 🌍
Poprzez zrozumienie i właściwe wdrożenie wskaźnika Sesje Luka Wartości Rynkowej, traderzy mogą uzyskać głębszy wgląd w dynamikę rynku, identyfikować potencjalne okazje handlowe i podejmować bardziej świadome decyzje oparte na nieefektywnościach price action. 🧠📈
Podsumowanie
It classifies gaps into two types: bullish gaps, indicating potential upward momentum and buying pressure, and bearish gaps, signaling possible downward momentum and selling pressure. Visually, it represents gaps with dynamic rectangles showing the price range and a midpoint level line to help traders quickly locate the gap's central price zone. Colors and line styles change to reflect the gap's active or mitigated status.
Traders can use this tool to visualize market inefficiencies, receive early warnings of trend reversals, and identify precise entry and exit points. Risk management features include color-coded gap states, tracking of gap mitigation when price returns to the gap zone, and customizable color settings. The indicator supports practical strategies such as using gap detection for trend continuation signals and combining it with other indicators for decision-making. Stop-loss placement near gap boundaries and monitoring gap mitigation for trend reversal are also supported.
Opinie klientów
5 | 100 % | |
4 | 0 % | |
3 | 0 % | |
2 | 0 % | |
1 | 0 % |