
Descrição
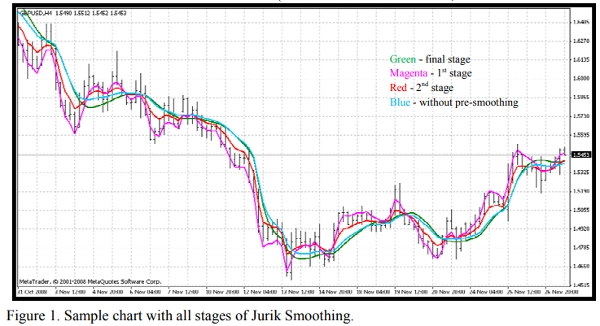
O suavizador Jurik inclui 3 etapas:
1ª etapa - suavização preliminar por EMA adaptativa: MA1 = (1-alpha)*Price + alpha*MA1[1];
2ª etapa - mais uma suavização preliminar pelo filtro de Kalman: Det0 = (Price - MA1)*(1-beta) + beta*Det0[1]; MA2 = MA1 + PR*Det0;
3ª etapa - suavização final pelo filtro adaptativo único Jurik: Det1 = (MA2 - JMA[1]) * (1-alpha)^2 + alpha^2 * Det1[1]; JMA = JMA[1] + Det1;
onde: - Price - Série de Preços - alpha - fator dinâmico (será descrito abaixo) - beta - razão periódica = 0.45*(Length-1)/(0.45*(Length-1)+2) - PR - Razão de Fase: PR = Phase/100 + 1.5 (se Phase < -100 então PR=0.5, se Phase > 100 então PR=2.5).
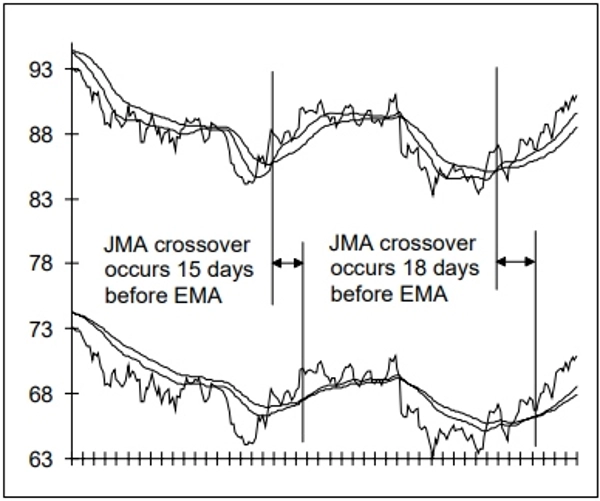
Figura 1. Gráfico de exemplo com todas as etapas do Suavizador Jurik. Você pode ver os resultados (Figura 1) de cada etapa por meio do indicador anexo JurikFilter_v2, alterando FilterMode: 0 - etapa final (JMA) 1 - 1ª etapa 2 - 2ª etapa 3 - apenas suavização final (sem preliminar).
O Fator Dinâmico é o fator periódico (beta) elevado a uma potência (pow):
alpha = beta ^ Pow,
onde: - pow = rVolty ^ pow1 - rVolty - volatilidade relativa do preço - pow1 - potência da volatilidade relativa com a seguinte fórmula: pow1 = len1 - 2 (se pow1 < 0.5 então pow1 = 0.5),
onde len1 - fator periódico adicional: len1 = Log(SquareRoot(len))/Log(2.0) + 2 (se len1 < 0 então len1 = 0).
Assim, você pode ver que o fator dinâmico é baseado na volatilidade relativa do preço, proporcionando a adaptabilidade necessária para este tipo de filtro de preço.
A fórmula para a volatilidade relativa do preço é rVolty = Volty/AvgVolty (se rVolty > len1^(1/pow1) então rVolty = len1^(1/pow1), se rVolty < 1 então rVolty = 1),
onde:
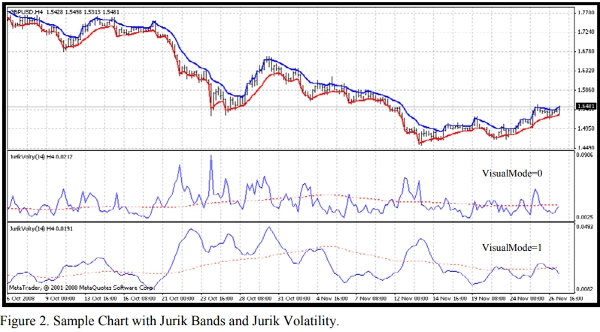
- Volty - volatilidade do preço baseada no cálculo das chamadas Bandas Jurik (VisualMode = 1).
- AvgVolty - volatilidade média para a qual Jurik usa um algoritmo bastante complexo de cálculo: AvgVolty = Average(vSum,AvgLen),
onde:
- vSum - soma incremental de (Volty - Volty[10])/10;
- AvgLen - período da média (Jurik usa 65).
Na minha versão do Filtro Jurik eu uso média simples em vez da média complexa do Jurik
Além disso, com o indicador anexo JurikVolty_v1 (Figura 2) você pode ver os valores para Volty (VisualMode=0), vSum (VisualMode=1) e AvgVolty (linha vermelha pontilhada).
A fórmula para a volatilidade do preço é Volty = máximo entre Abs(del1) e Abs(del2), se Abs(del1) = Abs(del2) então Volty = 0,
onde: - del1 - distância entre o preço e a banda superior del1 = Price - UpperBand - del2 - distância entre o preço e a banda inferior del2 = Price - LowerBand As Bandas Jurik são diferentes de quaisquer bandas de preço conhecidas como Bollinger, Keltner, Donchian, Fractal e assim por diante: se del1 > 0 então UpperBand = Price senão UpperBand = Price - Kv*del1 se del2 < 0 então LowerBand = Price senão LowerBand = Price - Kv*del2,
onde: - Kv - fator de volatilidade Kv = bet ^ SquareRoot(pow2). É fácil ver que essas bandas podem ser a base para um indicador de seguimento de tendência como o Parabólico de Wilder. Portanto, você pode ver que praticamente não há pontos obscuros no algoritmo da Média Móvel Jurik (JMA)
Resumo
Avaliações de clientes
5 | 0 % | |
4 | 100 % | |
3 | 0 % | |
2 | 0 % | |
1 | 0 % |


