
Opis
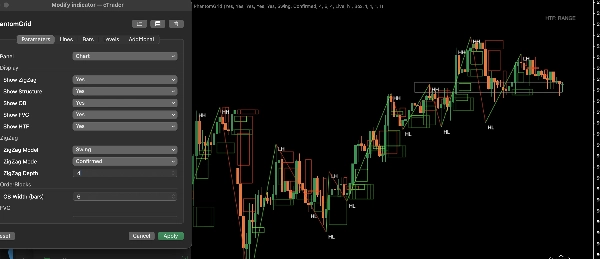
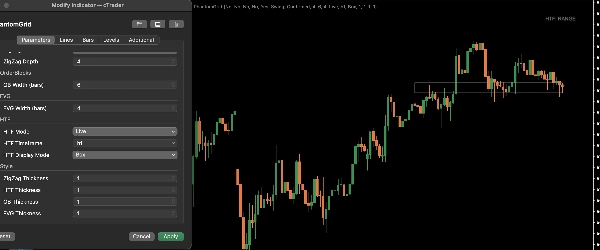
PhantomGrid to profesjonalny wskaźnik wizualizacji siatki, zaprojektowany, aby wnieść jasność, strukturę i precyzję do analizy ruchu cen.
Automatycznie rysuje dynamiczne poziomy siatki dla dowolnego symbolu i interwału czasowego, pomagając traderom identyfikować strefy reakcji, dopracowywać wejścia i wyjścia oraz planować transakcje z większą konsekwencją.
PhantomGrid jest stworzony zarówno dla traderów dyskrecjonalnych, jak i systematycznych, którzy chcą mieć czysty, uporządkowany schemat bez zbędnego zagracenia wykresu. Wskaźnik płynnie dostosowuje się do zmieniających się warunków rynkowych, zachowując jednocześnie wizualną przejrzystość i dokładność w różnych środowiskach.
Kluczowe cechy
• Automatyczne rysowanie dynamicznej siatki dla wszystkich symboli i interwałów czasowych
• Pomaga identyfikować strefy reakcji, obszary płynności i uporządkowane układy
• Czysty, minimalistyczny design wizualny dla analizy bez rozpraszania
• W pełni konfigurowalny odstęp siatki, styl i zachowanie
• Lekki i zoptymalizowany dla płynnej wydajności
• Odpowiedni do skalpowania, handlu intraday i swing tradingu
Jak traderzy korzystają z PhantomGrid
PhantomGrid pomaga traderom:
• wyraźniej strukturyzować ruch rynku
• identyfikować obszary reakcji o wysokim prawdopodobieństwie
• poprawiać timing wejść i wyjść
• zarządzać transakcjami w sposób bardziej systematyczny
• utrzymywać spójność między instrumentami
Działa skutecznie jako samodzielne narzędzie lub w połączeniu z istniejącymi strategiami i procesami pracy.
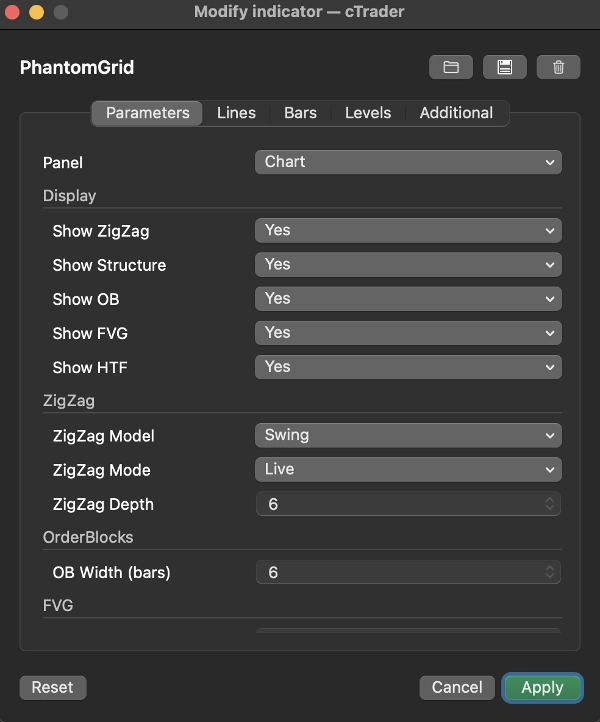
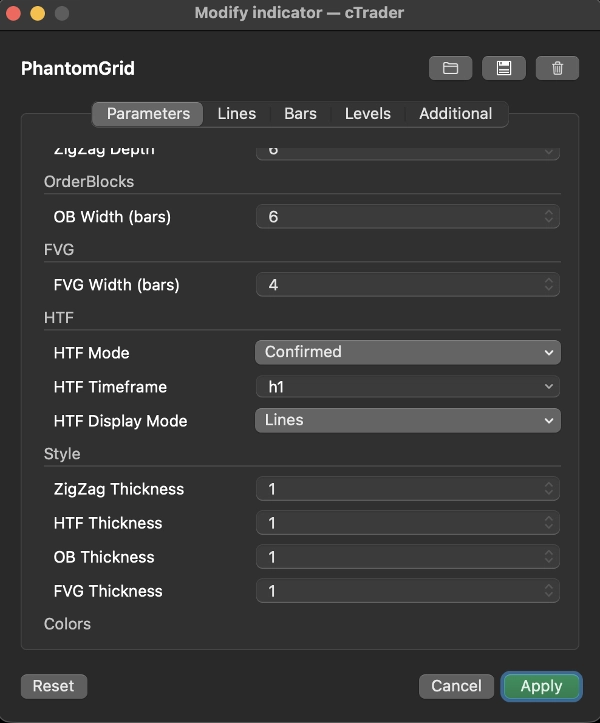
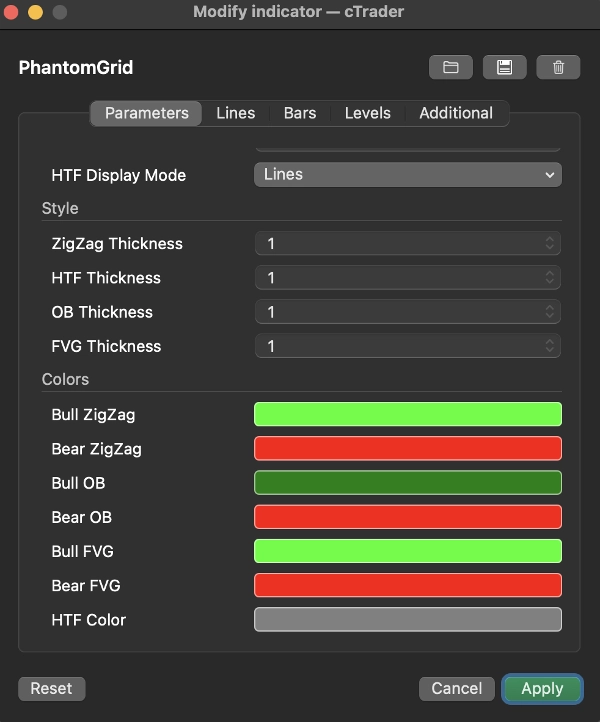
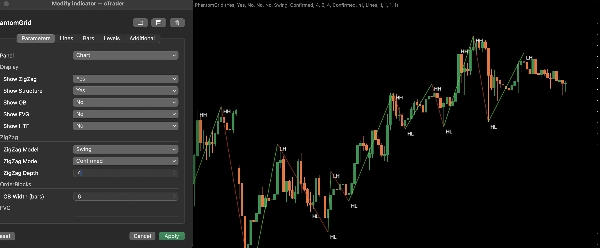
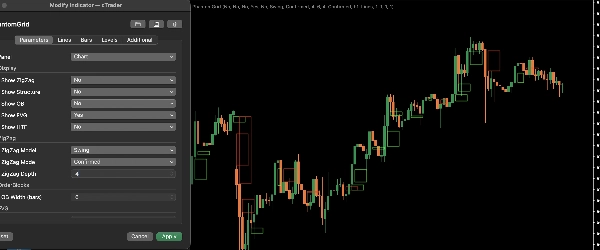
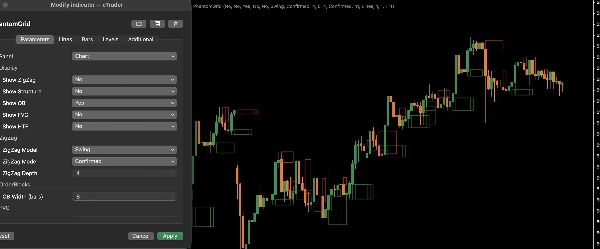
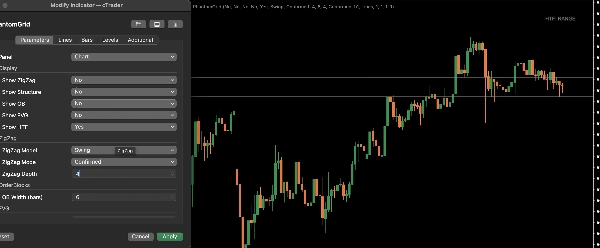
Opcje dostosowywania
PhantomGrid zawiera elastyczne ustawienia, które pasują do różnych stylów handlu:
• kontrola odstępów siatki
• ustawienia stylu wizualnego i kolorów
• regulacje widoczności dla czystszych układów
• dostrajanie zachowania dla różnych warunków zmienności
Te opcje pozwalają traderom dostosować wskaźnik do ich dokładnego procesu pracy i preferencji.
Wydajność i kompatybilność
PhantomGrid jest zaprojektowany dla stabilnej, wydajnej pracy i działa płynnie na wszystkich obsługiwanych symbolach i interwałach czasowych w cTrader. Wskaźnik integruje się naturalnie z profesjonalnymi ustawieniami wykresów, nie spowalniając działania platformy.
Zawiera pełną 7-dniową wersję próbną. Bez ograniczeń.
Wyniki z przeszłości nie gwarantują wyników w przyszłości. Ten wskaźnik ma charakter wyłącznie informacyjny i nie stanowi porady finansowej.
Podsumowanie
Opinie klientów
5 | 100 % | |
4 | 0 % | |
3 | 0 % | |
2 | 0 % | |
1 | 0 % |


