
Opis
Indeks Handlowalności Wielu Ram Czasowych
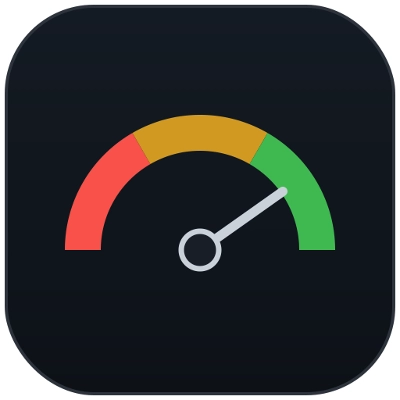
The Indeks Handlowalności Wielu Ram Czasowych to zaawansowany analizator warunków rynkowych, który identyfikuje, kiedy rynek jest statystycznie korzystny do handlu. Zamiast generować sygnały kupna lub sprzedaży, mierzy, jak handlowalne są obecne warunki rynkowe w różnych ramach czasowych, pozwalając skupić się tylko na okresach, w których ruch cen jest czysty, kierunkowy i zdolny do generowania znaczących ruchów.
W przeciwieństwie do tradycyjnych wskaźników opierających się na stałych progach, ten wskaźnik ciągle dostosowuje się do każdej ramy czasowej, porównując bieżące zachowanie rynku z własną historyczną bazą odniesienia. To samokalibrujące podejście pozwala mu działać na rynku Forex, indeksach, towarach, kryptowalutach i innych rynkach CFD bez konieczności ręcznej optymalizacji.
Jak to działa
Wskaźnik ocenia sześć niezależnych cech rynku w każdej ramie czasowej.
Trend versus losowość za pomocą Market Meanness Index.
Gładkość versus chaotyczność za pomocą Fractal Dimension.
Stosunek sygnału do szumu, aby określić, czy znaczące wahania dominują nad losowymi fluktuacjami.
Czystość trendu poprzez mierzenie, jak efektywnie cena się porusza zamiast ciągłego odwracania.
Częstotliwość okazji handlowych poprzez liczenie znaczących nóg wahań.
Netto postęp kierunkowy, aby określić, czy cena robi znaczący postęp, zamiast wielokrotnie się cofać.
Każdy czynnik jest normalizowany względem własnego historycznego zachowania za pomocą analizy statystycznej z-score. Oznacza to, że wskaźnik ocenia, czy obecne warunki są wyjątkowo korzystne, a nie tylko powyżej lub poniżej arbitralnego progu.
Znormalizowane czynniki są łączone w ważoną ocenę w zakresie od 0 do 100.
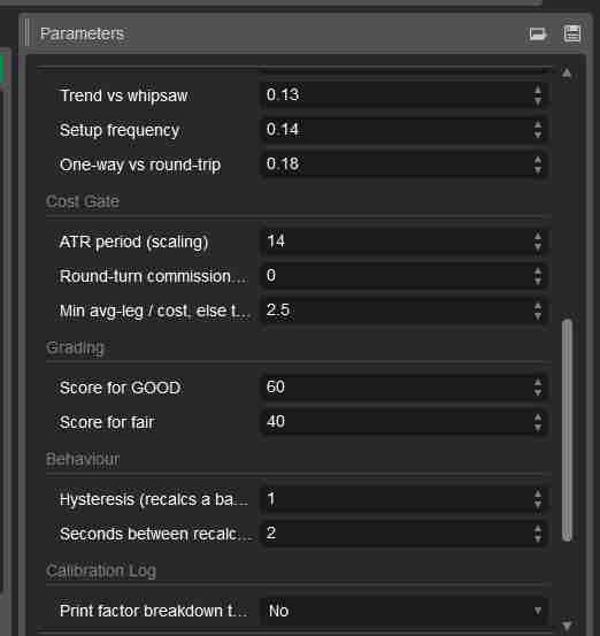
Wskaźnik zawiera również filtr kosztów transakcyjnych, który zapobiega otrzymywaniu wysokich ocen przez krótkie ramy czasowe, gdy średnie wahania cen są zbyt małe, aby realistycznie pokonać spready i prowizje.
Panel kontrolny
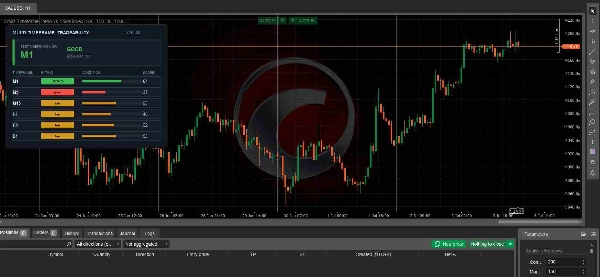
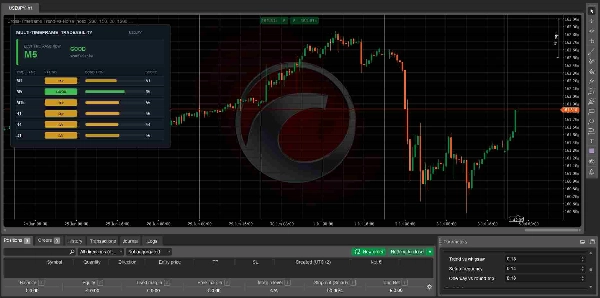
Panel analizuje sześć ram czasowych jednocześnie.
M1
M5
M15
H1
H4
D1
Każda rama czasowa otrzymuje jedną z trzech ocen.
DOBRA oznacza wysoce korzystne warunki rynkowe.
PRZYZWOITA oznacza akceptowalne, ale mniej idealne warunki.
SŁABA oznacza, że struktura rynku jest obecnie niekorzystna.
Wskaźnik automatycznie podświetla ramę czasową z najwyższą oceną wraz z jej aktualnym Wynikiem Handlowalności.
Interpretacja wyników
80 do 100 oznacza wyjątkowe warunki handlowe z silnym ruchem kierunkowym i niskim szumem rynkowym.
60 do 79 oznacza bardzo dobre warunki, w których strategie handlowe prawdopodobnie będą działać dobrze.
40 do 59 oznacza przeciętne warunki, gdzie zalecana jest selektywność.
Poniżej 40 oznacza słabą strukturę rynku z nadmierną losowością, chaotycznością lub niewystarczającym ruchem.
Wyższe wyniki nie przewidują kierunku rynku. Po prostu wskazują, że kierunek, który się rozwinie, jest statystycznie bardziej prawdopodobny do wygenerowania czystszego i bardziej handlowalnego ruchu cen.
Główne parametry
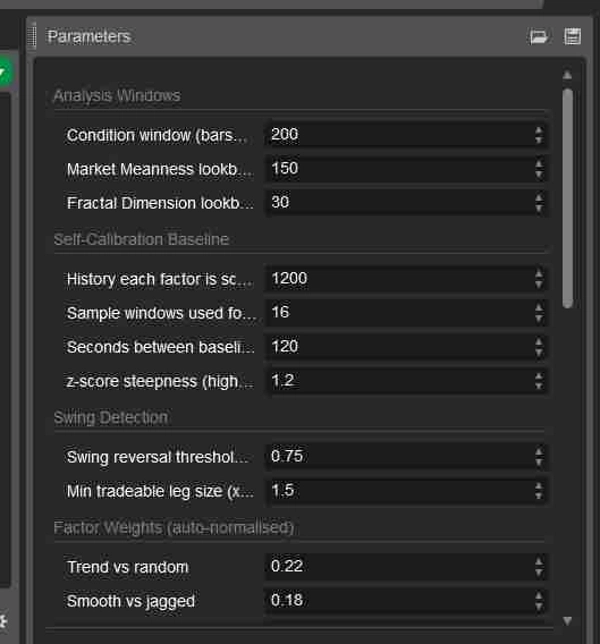
Okna analizy kontrolują, ile historii rynku jest używane do obliczania każdego czynnika.
Podstawa samokalibracji określa, jak wykonywana jest historyczna normalizacja.
Wykrywanie wahań dostosowuje czułość używaną do identyfikacji znaczących wahań cen.
Wagi czynników pozwalają zaawansowanym użytkownikom podkreślić lub zmniejszyć znaczenie każdej cechy rynku.
Brama kosztów kontroluje, jak agresywnie koszty transakcyjne wpływają na ostateczną ocenę.
Ustawienia oceny definiują progi punktowe dla klasyfikacji DOBRA i PRZYZWOITA.
Ustawienia panelu pozwalają na pełną kontrolę nad rozmiarem panelu i pozycją na ekranie.
Najlepsze zastosowania
Znajdowanie najbardziej handlowalnej ramy czasowej przed szukaniem wejść.
Unikanie bocznych, hałaśliwych lub niskiej jakości warunków rynkowych.
Filtrowanie sygnałów z istniejących strategii handlowych.
Ulepszanie handlu dyskrecjonalnego poprzez skupienie się tylko na statystycznie korzystnych środowiskach.
Wsparcie systemów algorytmicznych za pomocą adaptacyjnego filtra warunków rynkowych.
Dla kogo jest to przeznaczone
Ten wskaźnik jest odpowiedni dla początkujących, którzy chcą obiektywnego wskazania, kiedy warunki rynkowe są korzystne, a także dla doświadczonych traderów dyskrecjonalnych i algorytmicznych szukających adaptacyjnego filtra jakości rynku działającego na wielu instrumentach i ramach czasowych.
Ważne uwagi
Ten wskaźnik nie jest generatorem sygnałów kupna lub sprzedaży.
On nie przewiduje przyszły kierunek cen.
Mierzy tylko jakość obecnych warunków rynkowych.
Dla najlepszych rezultatów łącz go z własną strategią wejścia, wyjścia i zarządzania ryzykiem. Transakcje o najwyższym prawdopodobieństwie zwykle występują, gdy twoje własne ustawienie handlowe pokrywa się z ramami czasowymi otrzymującymi ocenę DOBRA Handlowalność.
Podsumowanie
The indicator provides a weighted Tradeability Score from 0 to 100 for six timeframes (M1, M5, M15, H1, H4, D1), classifying each as GOOD, FAIR, or POOR based on current market quality. It includes a transaction cost filter to account for realistic trading conditions on shorter timeframes. The dashboard highlights the highest scoring timeframe and its score, helping traders focus on periods with clean, directional price action suitable for trading.
This tool does not generate buy or sell signals nor predict price direction; instead, it serves as a market quality filter to improve discretionary or algorithmic trading by signaling when conditions are statistically favorable. Key parameters allow customization of analysis windows, swing detection sensitivity, factor weights, and grading thresholds. It is suitable for traders seeking objective guidance on market structure and tradeability across multiple instruments and timeframes.