
الوصف
ما هو مؤشر "النطاق الأولي"؟
هذا المؤشر هو تحويل لأداة "اختراق النطاق الافتتاحي" في Pine Script.
في الأصل كان يسمى ORB – اختراق النطاق الافتتاحي: تأخذ نطاق السعر لأول دقائق من الجلسة، ثم تتداول اختراق ذلك النطاق.
في هذا الإصدار أعدنا تسميته إلى IR – النطاق الأولي، لكن الفكرة هي نفسها:
- يقوم المؤشر ببناء عدة نطاقات أولية:
-
- IR5 – أول 5 دقائق
- IR15 – أول 15 دقيقة
- IR30 – أول 30 دقيقة
- IR60 – أول 60 دقيقة
- لكل IR لديك:
-
- أعلى IR
- أدنى IR
- منتصف IR (منتصف النطاق)
- يمكنك اختيار النطاقات النشطة والألوان التي تستخدمها.
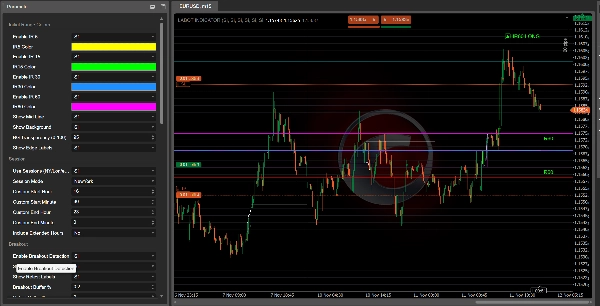
بمجرد اكتمال النطاق، يبحث المؤشر عن اختراق السعر له:
- اختراق فوق أعلى IR → IR60 طويل، IR30 طويل، إلخ.
- اختراق تحت أدنى IR → IR60 قصير، IR30 قصير، إلخ.
تظهر هذه العلامات على الرسم البياني حتى تتمكن من رؤية أي نطاق أولي أنتج الإشارة بسرعة.
المرشحات والتأكيدات
تم تصميم المؤشر لتجنب الاختراقات العشوائية من خلال دمج عدة مرشحات:
- مرشح الاتجاه
يمكنك استخدام: -
- VWAP
- EMA
- طول EMA مخصص
- VWAP + EMA معًا
يفضل الاختراقات في اتجاه الاتجاه (على سبيل المثال، طويل فقط عندما يكون السعر فوق VWAP/EMA).
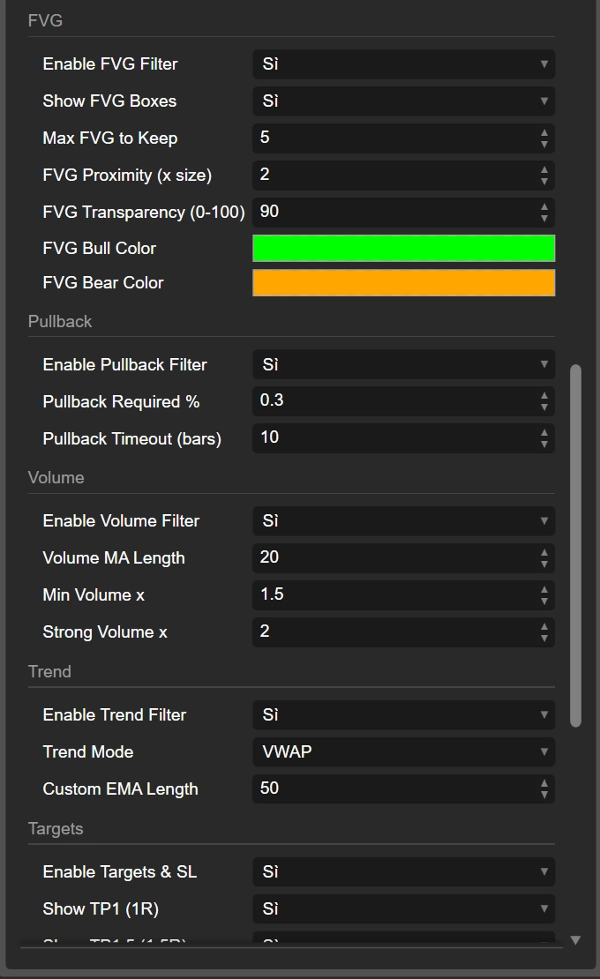
- مرشح الحجم
يقارن المؤشر الحجم الحالي بمتوسط متحرك للحجم: -
- تأكيد "عادي"
- حجم "قوي"
يمكن تجاهل الاختراقات ذات الحجم الضعيف إذا رغبت.
- مرشح FVG (فجوة القيمة العادلة)
يكشف عن فجوات FVG صاعدة وهابطة ويمكن أن يتطلب أن يحدث الاختراق بالقرب من FVG ذات صلة: -
- فجوة FVG صاعدة بالقرب من أعلى IR تدعم طويل
- فجوة FVG هابطة بالقرب من أدنى IR تدعم قصير
- مرشح التراجع
يمكنك طلب تراجع أدنى بعد الاختراق ونافذة زمنية (بالأشرطة) لحدوث هذا التراجع. هذا يساعدك على التركيز على الاختراقات التي "تتنفس" فعليًا قبل الاستمرار.
الاختراقات، إعادة الاختبار، والاختراقات الفاشلة
بعد اختراق النطاق الأولي، يتتبع المؤشر ما يفعله السعر بعد ذلك:
- يحسب عدد الأشرطة التي تبقى خارج النطاق.
- يتحقق مما إذا كان السعر يتحرك بعيدًا بما فيه الكفاية (المسافة الدنيا بالنسبة المئوية).
- ثم يراقب إعادة اختبار داخل النطاق.
يمكنك رؤية:
- IR60 طويل / IR60 قصير (اختراق)
- إعادة اختبار طويل / إعادة اختبار قصير علامات عندما يعود السعر بعد حركة قوية
- فشل طويل / فشل قصير علامات عندما يفشل الاختراق بسرعة ويعود السعر إلى النطاق بدون التزام.
هذا يمنحك ثلاثة أنواع من المعلومات:
- اختراق نظيف
- اختراق صحي مع إعادة اختبار
- اختراق مزيف/فاشل
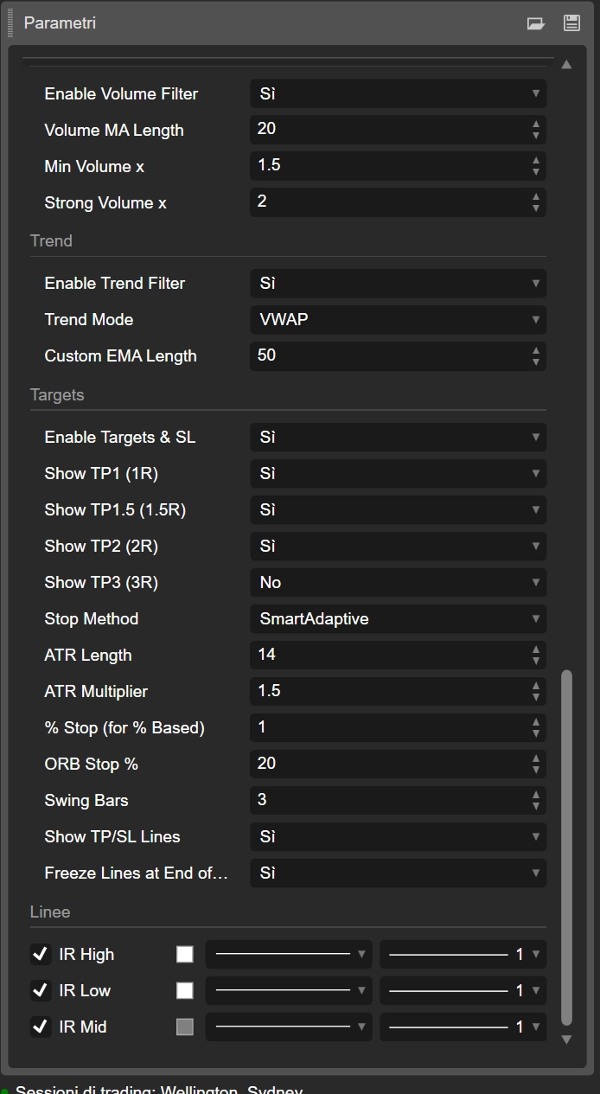
الأهداف، وقف الخسارة وتصور التداول
يقوم المؤشر أيضًا بحساب مستويات TP و SL تلقائيًا بناءً على:
- ATR
- ٪ من عرض IR
- نسب مئوية ثابتة لوقف الخسارة
- نقاط التأرجح
- أنماط ATR "ذكية" متكيفة ومقاسة
من سعر الدخول ومستوى الوقف يحسب عدة أهداف:
- TP1 (1R)
- TP1.5 (1.5R)
- TP2 (2R)
- TP3 (3R)
يمكنك اختيار الأهداف التي تريد عرضها.
يتم رسم الخطوط على الرسم البياني:
- IR_ENTRY_LONG / IR_ENTRY_SHORT
- IR_SL_LONG / IR_SL_SHORT
- IR_TP1 / IR_TP1.5 / IR_TP2 / IR_TP3
عندما يصل السعر إلى هدف أو وقف، يتم تحديث الحالة ويمكن "تجميد" الخطوط إما بعد آخر TP أو في نهاية اليوم، حسب إعداداتك.
باختصار
- الاسم القديم: ORB (اختراق النطاق الافتتاحي)
- الاسم الجديد: IR (النطاق الأولي) – نفس المفهوم، تسمية أنظف
- يبني نطاقات الجلسة المبكرة (IR5، IR15، IR30، IR60)
- يحدد اختراقات طويل / قصير، إعادة اختبارات، و اختراقات فاشلة
- يستخدم مرشحات الاتجاه، الحجم، FVG، والتراجع لتحسين الجودة
- يرسم الدخول، الوقف، وأهداف متعددة مباشرة على الرسم البياني
لذا عندما ترى "IR60 طويل" على الرسم البياني، فأنت في الأساس تنظر إلى اختراق النطاق الافتتاحي لأول 60 دقيقة من الجلسة – فقط باسم أكثر حداثة وقابلية للتخصيص والكثير من المنطق الإضافي خلفه.
الملخص
The indicator marks breakout signals when price moves above the range high (LONG) or below the range low (SHORT), displaying corresponding labels on the chart. It also tracks retests and failed breakouts, distinguishing clean breakouts, healthy retests, and fake moves.
To improve signal quality, the indicator incorporates multiple filters: trend filters using VWAP and EMA, volume filters comparing current volume to averages, Fair Value Gap (FVG) filters detecting bullish or bearish imbalances near breakout levels, and pullback filters requiring minimum retracements after breakouts.
Additionally, it calculates and plots automatic entry, stop loss, and multiple take profit levels based on ATR, percentage of the initial range width, fixed percentages, swing points, and adaptive ATR modes. These visual aids help traders manage risk and targets directly on the chart.
The Initial Range indicator supports various markets including Forex, stocks, indices, commodities, and cryptocurrencies, and is designed to enhance breakout trading strategies with customizable parameters and comprehensive trade visualization.
تقييمات العملاء
5 | 100 % | |
4 | 0 % | |
3 | 0 % | |
2 | 0 % | |
1 | 0 % |


