
Liquidity Shift Indicator
مؤشر
700 التنزيلات
الإصدار 1.0، Dec 2025
Windows, Mac
5.0
التقييمات: 1

الوصف
مؤشر تحول السيولة – أداة هيكل السوق والسيولة
يقوم مؤشر تحول السيولة بتحديد مستويات السيولة عند القمم والقيعان المتأرجحة ويرصد أحداث CISD (تغيير في حالة التسليم)، والتي غالبًا ما تشير إلى تحول في نية السوق بعد تفاعل السعر مع السيولة.
الميزات الرئيسية
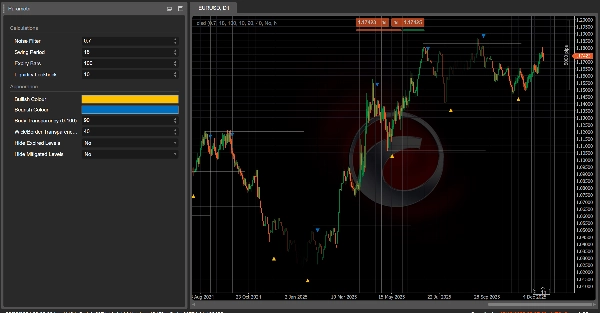
- يرسم تلقائيًا مستويات السيولة بناءً على القمم والقيعان المتأرجحة.
- يتتبع متى يتم تخفيف مستويات السيولة (تم مسحها/لمسها) ويمكن إخفاؤها اختياريًا للحصول على مخطط أنظف.
- يرصد ظروف CISD الصعودية والهبوطية باستخدام تغييرات حالة الشمعة و مرشح الضوضاء القابل للتكوين لتقليل الإشارات الخاطئة.
- يسلط الضوء على إشارات CISD القوية عندما يحدث CISD بعد فترة وجيزة من مسح السيولة المعاكسة (استنادًا إلى إعداد النظر إلى الوراء في السيولة).
- يساعد المتداولين على اكتشاف مسحات السيولة، تحولات الهيكل، الانعكاسات المحتملة، وإعدادات الاستمرار.
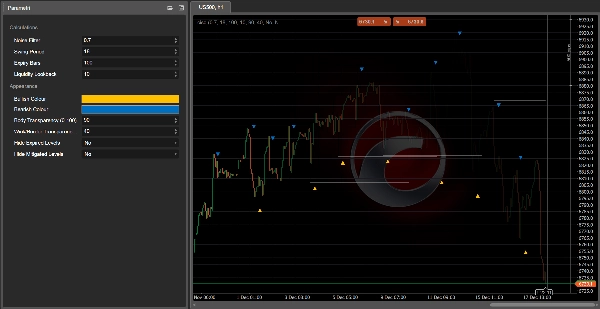
الإدخالات القابلة للتخصيص
- مرشح الضوضاء (يتحكم في الحساسية ويقلل الضوضاء)
- فترة التأرجح (يحدد كيفية اكتشاف نقاط التأرجح)
- أشرطة الانتهاء (مدة بقاء مستويات السيولة نشطة)
- النظر إلى الوراء في السيولة (مدى حداثة المسح ليتم اعتباره إشارة "قوية")
- خيارات لإخفاء المستويات المنتهية الصلاحية و/أو المخففة
ملاحظة
تم تصميم مؤشر تحول السيولة للتحليل والتأكيد. اجمعه دائمًا مع إدارة المخاطر المناسبة وسياق السوق الإضافي (الاتجاه، التقلب، مستويات الإطار الزمني الأعلى).
هل تريد cBot مبنيًا على هذا المؤشر؟ اتصل بنا!
الملخص
ملخص الذكاء الاصطناعي
The Liquidity Shift Indicator is a market structure and liquidity analysis tool designed to identify swing-high and swing-low liquidity levels. It detects Change in State of Delivery (CISD) events, which often indicate shifts in market intent following price interactions with liquidity. The indicator automatically plots liquidity levels based on swing points and tracks when these levels are mitigated (swept or touched), with options to hide mitigated or expired levels for clearer charts.
Key functionalities include detection of bullish and bearish CISD conditions using candle state changes combined with a configurable Noise Filter to minimize false signals. It highlights strong CISD signals that occur shortly after opposing liquidity sweeps, aiding traders in spotting liquidity sweeps, structural shifts, potential reversals, and continuation setups.
Customizable inputs allow adjustment of Noise Filter sensitivity, Swing Period for swing point detection, Expiry Bars defining liquidity level duration, and Liquidity Lookback to qualify strong signals. The indicator is intended for analysis and confirmation and should be used alongside proper risk management and additional market context such as trend, volatility, and higher-timeframe levels. It supports various markets including Forex, indices, commodities, stocks, and cryptocurrencies.
ملف تعريف المؤشر
تقييمات العملاء
5.0
التقييمات: 1
5 | 100 % | |
4 | 0 % | |
3 | 0 % | |
2 | 0 % | |
1 | 0 % |
تقييمات العملاء
December 22, 2025
Liquidity Shift Indicator highlights moments when market balance changes after liquidity runs. Great for SMC traders looking for early trend shifts and impulse confirmation. Clean, stable and best used with structure and FVG context.
مناقشة
الأسئلة الشائعة
Signal
Indices
Commodities
GBPUSD
RSI
Bollinger
Fibonacci
Scalping
AI
XAUUSD
NAS100
MACD
BTCUSD
Forex
Breakout
EURUSD
NZDUSD
Martingale
Prop
ZigZag
Supertrend
Fair Value Gap
SMC
Crypto
Grid
Stocks
ATR
USDJPY
VWAP
يتم توفير المنتجات المتاحة من خلال cTrader Store، بما في ذلك روبوتات التداول والمؤشرات والإضافات، من قبل مطوري الطرف الثالث وإتاحتها لأغراض الوصول المعلوماتي والفني فقط. cTrader Store ليس وسيطًا ولا يقدم نصائح استثمارية أو توصيات شخصية أو أي ضمان للأداء المستقبلي.


![شعار "Smart Money Concepts (SMC) [Iridio Capital]"](https://cdn.ctrader.com/image/webp/28b69fd1-ef54-4bed-9487-07e78e883be4_40934)


السعر
42.11M
حجم التداول
6.13M
الربح بالبيب
232
المبيعات
8.59K
التثبيتات المجانية