📊 القيمة المتوقعة لـ VPOC مونتي كارلو
https://chartshots.spotware.com/c/69c558e2c68df
تحليل السوق المتكامل: ملف الحجم + الإسقاط الإحصائي 🎯
🎯 ما هو؟
قيمة VPOC مونتي كارلو المتوقعة هي مؤشر تحليل كمي يجمع بين منهجيتين احترافيتين للتداول:
- ملف عمق السوق (VPOC) - يحدد مكان تركيز الحجم الحقيقي 🏦
- محاكاة مونتي كارلو - تتوقع السيناريوهات المستقبلية بناءً على الاحتمالات الإحصائية 📈
النتيجة هي نظام تحليل يخبرك أين المال (نقطة التحكم) وأين من المحتمل أن يذهب (القيمة المتوقعة المتوقعة) 🧠
⚙️ كيف يعمل؟
الوحدة 1: ملف العمق (VPOC) 📊
يقوم المؤشر بتحليل آخر 200 شريط (قابل للتكوين) ويوزع الحجم عبر 30 مستوى سعري. يحسب:
- نقطة التحكم (PoC): السعر الذي يحتوي على أعلى حجم تداول - يمثل إجماع السوق حيث كان المشترون والبائعون أكثر نشاطًا ⚖️
- دلتا: الفرق بين ضغط الشراء مقابل البيع عند كل مستوى 🔄
- خريطة الحرارة: تصور تركيز النشاط 🔥
المنطق: يميل السعر إلى العودة نحو نقطة التحكم لأن معظم السيولة المعلقة توجد هناك. إذا كان السعر بعيدًا عن نقطة التحكم، فهناك احتمال أعلى للعودة 🔄
الوحدة 2: الإسقاط الإحصائي (مونتي كارلو) 🎲
يستخدم المحاكاة العشوائية (1,000 تكرار بشكل افتراضي) لتوقع السعر المستقبلي:
- يحسب الاتجاه التاريخي للأصل والتقلب السنوي 📉📈
- ينشئ مسارات عشوائية باستخدام التوزيع الطبيعي (نموذج الحركة البراونية الهندسية) 🌊
- يقدر القيمة المتوقعة مع نطاقات الانحراف المعياري (±1 سيغما) 📏
الصيغة المطبقة: - الانجراف لكل شريط = العائد السنوي / أيام التداول 🧮
- التقلب لكل شريط = التقلب السنوي / √الأيام ⚡
- الإسقاط = السعر الحالي × e^(إجمالي الانجراف + عشوائي طبيعي × إجمالي التقلب) 🔢
الوحدة 3: التآزر 🔗
يجمع بين التحليلين لتوليد إشارات سياقية:
جدول
شرط الإشارة المعنى
صعودي ↑ 🟢 السعر > PoC + الإسقاط الإيجابي تأكيد اتجاه صعودي بالحجم
هبوطي ↓ 🔴 السعر < PoC + الإسقاط السلبي تأكيد اتجاه هبوطي بالحجم
فرصة ★ 💡 السعر < PoC + الإسقاط الإيجابي احتمال ارتداد من دعم الحجم
تباعد ⚠️ ⚠️ السعر > PoC + الإسقاط السلبي تحذير من احتمال انعكاس
📈 ما هو استخدامه؟
✅ تحديد مستويات الحجم الرئيسية - تعمل نقطة التحكم كمغناطيس للسعر 🧲
✅ تقدير احتمالات النجاح - نسبة السيناريوهات الفائزة في المحاكاة 🏆
✅ تقييم المخاطرة/العائد - نسبة شارب المتوقعة والانحراف المعياري 📊
✅ تأكيد اتجاه التداول - التآزر بين الموضع بالنسبة لنقطة التحكم والزخم الإحصائي 🎯
✅ الإسقاط المستهدف - مستويات السعر المتوقعة لفترة الاحتفاظ المحددة 🎯
🎮 التكوين والاستخدام
المعلمات الرئيسية:
جدول
المجموعة المعلمة الافتراضي الوصف
تحليل ملف العمق 200 شريط التاريخ لحساب ملف الحجم
مستويات السعر 30 دقة الملف (المزيد من المستويات = مزيد من التفاصيل) 🔍
الإزاحة الأفقية 5 موضع الملف على الرسم البياني 📏
أقصى مدة تشغيل للإسقاط الإحصائي 252 شريط أفق زمني للإسقاط ⏱️
رأس المال المستثمر 1,000$ الأساس للحسابات المالية 💰
المحاكاة 1,000 عدد المسارات العشوائية (المزيد = أدق، أبطأ) 🔄
معدل خالي من المخاطر 5% لحساب نسبة شارب 📉
استراتيجية تاريخية استخدام TP/SL لا تفعيل لمحاكاة بأهداف ثابتة 🎯
كيفية تفسير جدول النتائج:
plain
نسخ
إحصائيات القيمة المتوقعة
┌──────────────┬─────────┬─────────┬─────────┬────────┐
│ الطريقة │ المبلغ $│ العائد %│ معدل الفوز│ شارب │
├──────────────┼─────────┼─────────┼─────────┼────────┤
│ تاريخي │ -19.56$ │ -1.96% │ 47.2% │ -1.24 │
│ محاكاة │ -54.05$ │ -5.40% │ 21.4% │ -4.95 │
└──────────────┴─────────┴─────────┴─────────┴────────┘
- تاريخي: متوسط أداء الصفقات المماثلة السابقة 📜
- محاكاة: متوسط نتيجة 1,000 محاكاة مونتي كارلو 🎲
- معدل الفوز: نسبة السيناريوهات ذات النتيجة الإيجابية ✅
- شارب: العائد المعدل حسب المخاطر (أكثر من 1 جيد، سلبي سيء) 📈
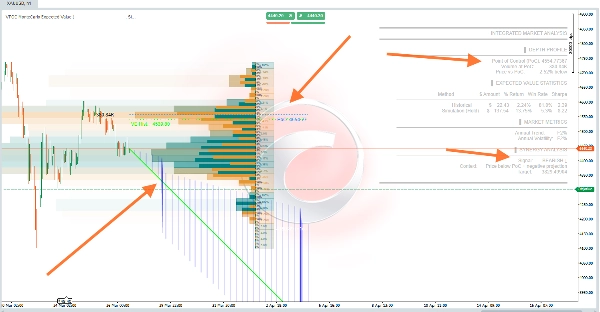
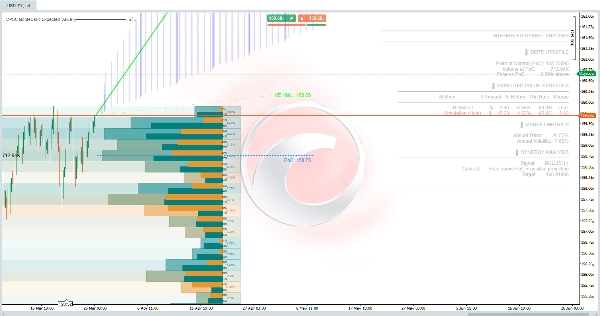
🖼️ العناصر المرئية على الرسم البياني
جدول
العنصر اللون المعنى
ملف الحجم تدرج برتقالي/أزرق تركيز النشاط حسب المستوى السعري 🎨
خط PoC نقاط زرقاء نقطة التحكم المتوقعة في المستقبل 🔵
خط إسقاط EV أخضر/أرجواني مسار السعر المتوقع 🟢🔴
نطاق ±1σ خطوط بيضاء منقطة نطاق الثقة 68% 📊
خط EV التاريخي أخضر منقط القيمة المتوقعة بناءً على البيانات التاريخية 🟢
منطقة الإسقاط تعبئة زرقاء شفافة منطقة الاحتمالية بين النطاقات 🔵
⚠️ مهم - القيود
- ليست إشارة شراء/بيع - إنها أداة تحليل احتمالية 🛠️
- تفترض محاكاة مونتي كارلو ثبات التوزيع التاريخي (لا تتنبأ بأحداث البجعة السوداء) 🦢❌
- نقطة التحكم ديناميكية - تعيد الحساب عند كل شريط جديد 🔄
- تتطلب تاريخًا كافيًا - حد أدنى 252 شريطًا لإسقاطات موثوقة 📊
- العملات المشفرة - يقوم المؤشر بضبط تلقائي لـ 365 يوم تداول سنوي مقابل 252 للأسواق التقليدية 🪙
💡 استراتيجية الاستخدام الموصى بها
- ابحث عن فرصة ★ 💡 - السعر أقل من نقطة التحكم ولكن مع إسقاط إيجابي (احتمال التقليل من القيمة)
- أكد بمعدل الفوز > 50% - احتمال إحصائي أعلى للنجاح ✅
- تجنب التباعد ⚠️ ⚠️ - السعر مبالغ فيه مقارنة بالحجم الفعلي
- استخدم نقطة التحكم كمرجع - وقف أو أهداف حول هذا المستوى من السيولة 🎯
- قارن بين التاريخي والمحاكاة - إذا اختلفا كثيرًا، فإن نظام السوق يتغير 🔄