"Quantum Flow" 标识
指标
版本 1.0, May 2026
Windows 版、Mac 版
"Quantum Flow" 已上传图片
注册日期 21/02/2025
461.42M
交易量
178.3K
盈利点数
12
销售
6.14K
免费安装

What is Quantum Flow?

Quantum Flow is a precision overlay indicator for cTrader that measures where the current price stands within its historical range — expressed as a percentile rank from 0 to 100. Unlike traditional oscillators such as RSI or Stochastic, Quantum Flow does not rely on fixed overbought/oversold thresholds. Instead, it dynamically adapts to the actual price range of your chosen lookback window, giving you a far more accurate and context-aware picture of market strength.

The result is a clean, actionable signal system that tells you not just what price is doing, but how extreme that move is relative to recent history — and whether it has the multi-timeframe backing to be trusted.


Key Features

> Percentile Rank Engine

Adaptive to any market and any timeframe. No fixed levels — the indicator calibrates itself to the actual price action in your lookback window. Works on Forex, Indices, Commodities, Crypto, and Stocks.

> Dynamic Bar Coloring

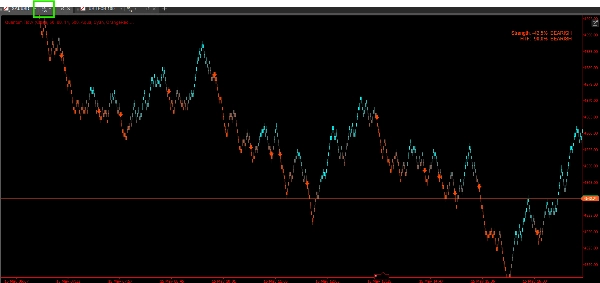
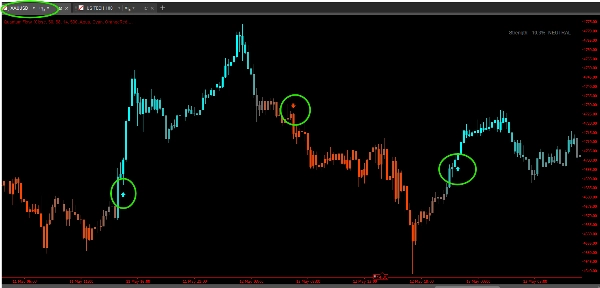
Every bar is colored with a smooth gradient that reflects the current rank intensity. Bullish momentum transitions from grey to your bull color (default: Cyan), bearish from grey to your bear color (default: OrangeRed). At a glance, you can read the entire chart's momentum history without studying a separate oscillator panel.

> Signal Arrows with ATR-Based Placement

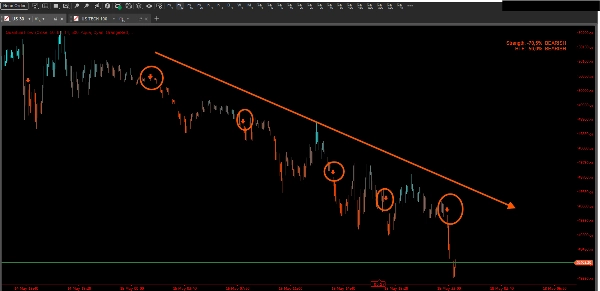
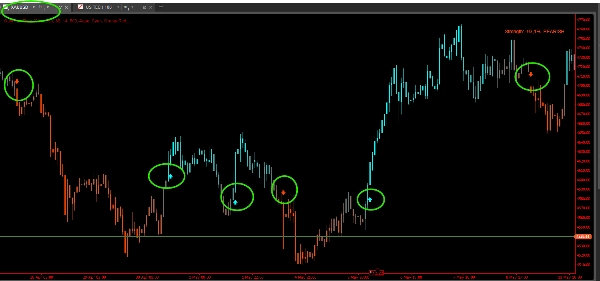
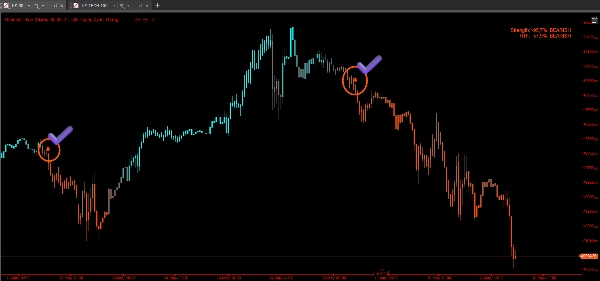
When the rank crosses the signal threshold (default: 88 for bull, 12 for bear), Quantum Flow draws an arrow above or below the bar. The arrow offset is calculated using the current ATR so it never clutters the candles — it scales automatically with volatility.

Signals fire only once per trend direction — there is no re-entry spam. Once a bull signal is active, no further bull arrows are drawn until the market reverses and re-qualifies.

> Multi-Timeframe (MTF) Confirmation

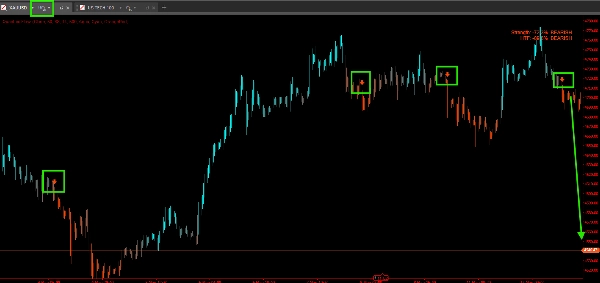
One of Quantum Flow's most powerful features. Enable MTF mode and select a higher timeframe (e.g., H1 when trading M15). Quantum Flow will only show a bull signal on your current chart if the higher timeframe rank also confirms bullish bias — and vice versa for bear signals.

This single filter dramatically reduces counter-trend noise and keeps you aligned with the dominant market flow.

> Bar Close Alerts

Alerts fire after bar close — not on an intrabar fluctuation. This means every alert you receive corresponds to a confirmed, closed signal bar. No more false triggers from wicks or temporary spikes. Supports both popup alerts and sound notifications.

> Real-Time Strength Panel

A compact, always-visible panel (configurable position: TopLeft, TopRight, BottomLeft, BottomRight) shows:

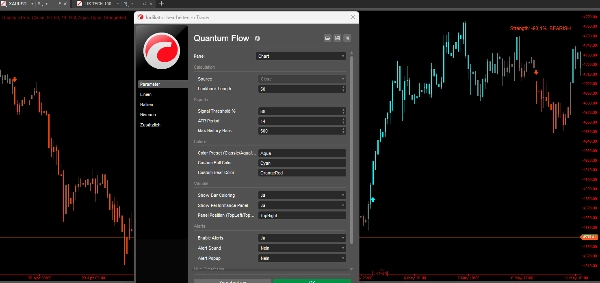
  • Strength % of the current bar expressed as a deviation from neutral (e.g., +76% Bullish)
  • HTF Strength % when MTF mode is enabled
  • Plain-language bias label: BULLISH / BEARISH / NEUTRAL

> 5 Color Presets + Custom Colors

Choose from Classic (green/red), Aqua (cyan/orange — default), Cosmic (teal/purple), Cyber (cyan/dark orange), or Neon (yellow/magenta). Or define your own exact colors using any cTrader-supported color name.

> History Window Control

Define exactly how many historical bars receive coloring and signal arrows (default: 500, max: 5000). Useful for keeping the chart clean without loading unnecessary history.


How to Use Quantum Flow

Step 1 — Apply to Chart

Add Quantum Flow to any chart as an overlay. Select your preferred Source (Close by default) and set the Lookback Length to match your trading style:

  • Scalping / M1–M5: 20–30 bars
  • Intraday / M15–H1: 50 bars (default)
  • Swing / H4–Daily: 100–200 bars

Step 2 — Read Bar Colors

Once applied, the chart will repaint bar colors based on the live rank:

  • Bright bull color = price is near the top of its recent range → momentum is strong
  • Bright bear color = price is near the bottom → selling pressure dominates
  • Grey / muted tone = price is near the midpoint → no clear directional edge, avoid trading

Step 3 — Wait for Signal Arrows

Do not act on color alone. Wait for an arrow:

  • Up arrow below the bar = rank has reached the bull threshold → potential long setup
  • Down arrow above the bar = rank has reached the bear threshold → potential short setup

Combine with your own entry model — support/resistance, candlestick patterns, or order flow. Quantum Flow identifies momentum context, not the exact entry trigger.

Step 4 — Use MTF Confirmation (Recommended)

Enable Show MTF Confirmation and set the Higher Timeframe to 3–5x your current chart timeframe. For example:

  • Trading on M15 → set HTF to H1
  • Trading on H1 → set HTF to H4 or Daily

Only take long setups when both the current timeframe and the HTF show bullish rank. This single rule alone can significantly improve your win rate by keeping you on the right side of the larger trend.

Step 5 — Monitor the Strength Panel

Use the panel as a quick reference for current bias without scrolling the chart. A reading of +60% BULLISH or higher on both timeframes is a strong confluence zone. A reading near 0% NEUTRAL on either timeframe suggests waiting.

Step 6 — Set Alerts

Enable alerts to get notified on confirmed bar-close signals without watching the screen. The popup message includes the symbol, timeframe, and signal direction so you can trade across multiple charts simultaneously.


Who Is This For?

Quantum Flow is designed for traders who want a clean, objective momentum reading without the noise of traditional oscillators. It suits:

  • Intraday traders who need fast, reliable visual feedback on momentum
  • Swing traders who want to enter only when multi-timeframe momentum aligns
  • Trend followers who want to avoid fighting dominant momentum
  • Price action traders who want a non-subjective context layer added to their existing setup


What Makes Quantum Flow Different?

Most momentum indicators measure rate of change or relative strength versus a fixed formula. Quantum Flow instead asks a simpler, more powerful question: "Is this bar closer to a recent high or a recent low?"

This percentile-rank approach means:

  • No lagging moving average at its core
  • No fixed overbought/oversold thresholds that fail in trending markets
  • Full adaptability to any volatility regime
  • Bar coloring gives you a continuous visual history — not just a separate oscillator you have to correlate mentally

Combined with the MTF filter and bar-close alerts, Quantum Flow gives you a complete, self-contained momentum system that works across all markets and timeframes — ready to use out of the box.

指标配置
指标分类
趋势
输出类型
可视化
信号
过滤器
数据要求
仅 K 线
支持的信号
突破
反转
趋势强度
波动性
触及水平位
突破水平位
0.0
评价:0
客户评价
该产品尚无评价。已经试过了?抢先告诉其他人!
ROC
Key Levels
RSI
ATR
Moving Average
Stochastic
Support & Resistance
cTrader Store 提供的所有产品,包括交易机器人、指标和插件,均由第三方开发者提供,仅供信息参考和技术访问之用。cTrader Store 并非经纪商,不提供投资建议、个人推荐或任何未来业绩保证。

该作者的其他作品

指标
RSI
Forex
+4
High-probability trading signals in the fast-paced world of forex and CFD trading.
指标
Prop
Forex
+14
High-Performance Renko Chart Indicator with Advanced filtering method.
"Rsi + Volume" 标识
评分最高
5.0
(2)
免费
指标
RSI
Signal
+1
This indicator combines RSI (Relative Strength Index) with volume analysis to generate more reliable trading signals.
指标
SMC
Prop
+15
Automatic Elliott Wave Detection with Professional Filters
指标
The Renko Moving Average Cross indicator combines classic EMA crossover signals with Renko-filtered prices.
指标
RSI
Volume
+5
Multi-mode signal indicator with 3 filters, real-time bar-close detection, no repainting, and full alert system.
指标
Signal
Scalping
Enhance Your Trading Strategy with the Larry Williams 9-5-3 Indicator
指标
MACD
Key Levels
+2
Trend indicator with multi-timeframe filters, generating signals only on fully completed bricks & candles. No Repaint.
指标
EMA
RSI
+2
Advanced TDI indicator with Shark Fin signals, chart arrows, MTF RSI, divergence detection and smart alerts.

猜您喜欢

"ADX and ADI" 标识
评分最高
5.0
(2)
免费
指标
This custom indicator is a complete implementation of the Average Directional Index and Directional Indicators.
指标
AI
ATR
+20
Buy and Sell Signals
指标
SMC
Prop
+11
MarketStructurePro – Smart BOS/CHoCH
指标
ATR
Statistical arbitrage with correlation, triangulation & multi-TF scanner. ATR-based real-time gap triggers.
指标
AI
ATR
+26
MacD Custom Indicator-Multiple Time Frame
指标
SMC
Forex
+5
MMXM Structure by LudwigICT – Professional Market Structure Mapping Tool
指标
Prop
Forex
+4
Camarilla by Bullitt Traders — a precise, non-repainting pivot indicator for cTrader.
指标
EMA
RSI
+5
MACD Colour Histogram with 11 Moving Average Types, Multi-timeframe confirmation and Sound Signal Alert.
指标
SMC
Prop
+19
Most advanced Volume Profile Pivot Box indicator — auto pivots, volume zones, smart candle coloring & SMC trading tool.
指标
A function demo version of VWAP indicator with std. dev. bands. Expired on 1st Aug, 2025.
指标
MACD
Prop
+14
Customize the MACD! Choose colors, get real-time tick updates, and see crossover points for enhanced trading precision.
指标
ADX
ATR
+5
Signal Quality Score - 0-100 filter combining RSI, Volume, ATR, Trend Strength & Alignment. Works on ANY chart type.
指标
ATR
Volume
+5
RANGER — Multi-Timeframe Trend & Signal Indicator
指标
ATR
RSI
+3
🚀 Specialized algorithm is designed to confirm entry and exit points with precision 🎯
指标
The Weekly Daily Levels indicator shows the OHLC, and mid-point prices for the previous day and week.
指标
Prop
E7 BBKG indicator with 80% plus accuracy used to show both, possible reversal and trend.
指标
SMC
Prop
+17
Unlock the true intent of market participants with the Classic Proportional Cumulative Volume Delta CVD!
指标
ATR
RSI
+8
Multi-timeframe market-state dashboard: Score (-100..+100) + UP/NEUT/DN per TF, with optional closed-candle arrows.
注册日期 21/02/2025
461.42M
交易量
178.3K
盈利点数
12
销售
6.14K
免费安装