present
Registrati e ricevi uno sconto da $50 sul tuo primo acquisto
Trading product for QuarterlyTheoryStrategy Indicatore Fair Value Gap BOS, image 1
QuarterlyTheoryStrategy
Indicatore
108 download
Versione 1.0, May 2026
Windows, Mac
4.0
Recensioni: 2
Trading product for QuarterlyTheoryStrategy Indicatore Fair Value Gap BOS, image 2
Trading product for QuarterlyTheoryStrategy Indicatore Fair Value Gap BOS, image 3
Da 21/02/2025
466.3M
Volume negoziato
180.83K
Profitto in pip
26
Vendite
7.45K
Installazioni gratuite

Descrizione

Indicatore Teorico Trimestrale (ICT) — Zone di Sessione & Segnali Intelligenti

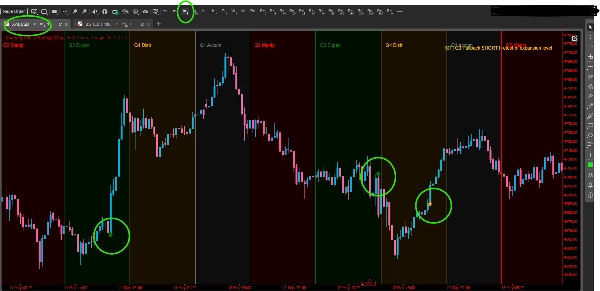
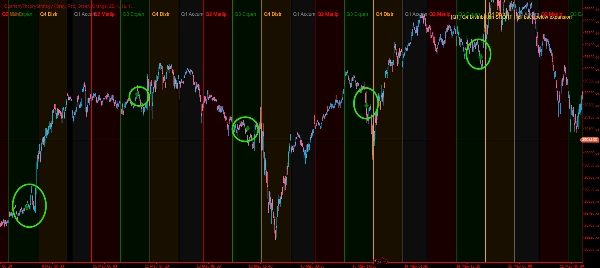
L'Indicatore Teorico Trimestrale porta il framework del ciclo di sessione ICT (Inner Circle Trader) direttamente sul tuo grafico cTrader. Basato sul concetto che ogni giornata di trading di 24 ore è divisa in quattro fasi distinte di 6 ore, l'indicatore identifica e visualizza automaticamente:

  • Q1 – Accumulazione (18:00–00:00 NY): Posizioni di smart money in modo silenzioso
  • Q2 – Manipolazione (00:00–06:00 NY): Movimenti falsi & caccia agli stop
  • Q3 – Espansione (06:00–12:00 NY): Il vero movimento direzionale
  • Q4 – Distribuzione (12:00–18:00 NY): Realizzazione dei profitti & inversioni


Caratteristiche Principali

Sfondo delle Zone di Sessione Ogni trimestre è evidenziato con uno sfondo colorato completamente personalizzabile e etichettato direttamente sul grafico. Colori, opacità e spessore del bordo sono tutti regolabili. Le zone si aggiornano dinamicamente durante lo scorrimento e lo zoom.

4 Segnali Intelligenti di Entrata

  • Q2 Caccia agli Stop — rileva le spazzate dei massimi/minimi di Q1 che chiudono nuovamente all’interno, segnalando un’inversione-trappola
  • Entrata di Espansione Q3 — si attiva quando il prezzo rompe il range di Q2, segnando il vero movimento direzionale
  • Entrata di Ritracciamento Q3 — identifica i retest del livello di breakout dell’espansione per entrate a rischio inferiore
  • Distribuzione Q4 — avvisa quando il prezzo attraversa nuovamente il livello di espansione durante la fase di distribuzione

Ogni segnale è disegnato come una freccia direzionale (↑↓) direttamente sulla barra del grafico dove la condizione è soddisfatta.

Avvisi Integrati Quando l’indicatore è attivo su una barra in tempo reale, riproduce un suono e mostra un messaggio a schermo per ogni segnale attivato — nessuna necessità di monitoraggio manuale.

Controllo delle Prestazioni Un parametro configurabile Giorni da Mostrare (1–60 giorni) limita quanto indietro vengono disegnate le zone e i segnali, mantenendo basso l’uso della RAM anche su timeframe ad alta frequenza.

Allineamento alla Sessione NY Supporta sia offset EST (UTC−5) che EDT (UTC−4), garantendo confini di zona accurati indipendentemente dall’orario del server del tuo broker.

Riepilogo

AI summary
The Quarterly Theory Indicator (ICT) integrates the Inner Circle Trader session cycle framework into cTrader charts by dividing each 24-hour trading day into four color-coded 6-hour zones: Q1 Accumulation (18:00–00:00 NY), Q2 Manipulation (00:00–06:00 NY), Q3 Expansion (06:00–12:00 NY), and Q4 Distribution (12:00–18:00 NY). Each zone is visually distinguished with customizable background colors, opacity, and borders that update dynamically with chart navigation.

The indicator provides four smart entry signals directly on the chart as directional arrows: Q2 Stop-Hunt (detects false breakouts within Q1 highs/lows), Q3 Expansion Entry (signals breakout from Q2 range), Q3 Pullback Entry (identifies retests of breakout levels), and Q4 Distribution (alerts on price crossing back through expansion levels). These signals include real-time alerts with sound and on-screen messages when conditions occur on live bars.

Additional features include a configurable "Days to Show" parameter to limit historical data display for performance optimization and support for both EST and EDT time offsets to align session zones accurately with New York time. The indicator is tagged with market structure concepts such as Fair Value Gap, Break of Structure, and Liquidity Sweep, and outputs visualizations, signals, and filters based on bar data.
Profilo indicatore
Categoria indicatore
Struttura del mercato (SMC)
Tipo di output
Visualizzazione
Segnali
Filtro
Requisiti per i dati
Solo barre
Segnali supportati
Livello rotto
Livello raggiunto
Rottura

Recensioni dei clienti

4.0
Recensioni: 2
5
0 %
4
100 %
3
0 %
2
0 %
1
0 %
Recensioni dei clienti
September 10, 2026
QuarterlyTheoryStrategy is a clear ICT-style session-cycle indicator that divides the trading day into Q1 Accumulation, Q2 Manipulation, Q3 Expansion and Q4 Distribution zones and adds configurable directional signals. Testing on EURUSD and XAUUSD confirmed the four-zone structure and Q3 Pullback signals in both LONG and SHORT directions. The main reservations were one instance of missing zone backgrounds on EURUSD H1 and label crowding on wider H1 views.
May 27, 2026
Very useful, minor improvements needed Great tool that delivers consistent signals in trending markets. It struggles a bit in choppy or sideways conditions, but that's true for most indicators. Once you understand its strengths and pair it with proper risk management, it becomes a powerful part of your strategy.

Discussioni

Domande frequenti

Fair Value Gap
BOS
Liquidity Sweep
I prodotti disponibili tramite cTrader Store, inclusi bot di trading, indicatori e plugin, sono forniti da sviluppatori terzi e resi disponibili esclusivamente a scopo informativo e di accesso tecnico. cTrader Store non è un broker e non fornisce consulenze in materia di investimento, raccomandazioni individualizzate o garanzie di risultati futuri.

Altro da questo autore

Indicatore
RSI
Forex
+4
High-probability trading signals in the fast-paced world of forex and CFD trading.
Indicatore
Prop
Stocks
+4
High-Performance Renko Chart Indicator with Advanced filtering method - built for Renko and candlestick charts.
Indicatore
ATR
MSS
+5
Detects ICT Turtle Soup setups — liquidity sweeps with MSS confirmation, ATR filter & kill zone session filter.
Indicatore
SMC
Prop
+15
Automatic Elliott Wave Detection with Professional Filters
Indicatore
Fibonacci
Key Levels
DailyTargets: Dynamic ADR-based levels & targets. Includes Buy/Sell zones, previous Hi/Lo, and automated trend alerts.
Indicatore
EMA
RSI
+2
Advanced TDI indicator with Shark Fin signals, chart arrows, MTF RSI, divergence detection and smart alerts.
Indicatore
Key Levels
Order Block
+3
Marks NY session range, detects wick sweeps beyond box edges.. One signal per day. Overlay, no repainting!
Indicatore
MACD
Key Levels
+2
Trend indicator with multi-timeframe filters, generating signals only on fully completed bricks & candles. No Repaint.
Indicatore
Key Levels
Supertrend
+3
Marks London and New York session opening zones and alerts you instantly on breakouts.
cBot
EMA
SL Manager
+5
Fully automated dual-symbol hedging cBot for cTrader.
20.6%
ROI
8.66
Fattore di profitto
Indicatore
Volume
Key Levels
KasePeakOscillator: Advanced volatility-adjusted momentum tool with automated peak detection and divergence alerts.
cBot
RSI
Aggressive
automates entries based on the RSX indicator — a smoothed, low-lag variant of the classic RSI.
1.67
Fattore di profitto

Potrebbe interessarti anche

Indicatore
SMC
Prop
+16
📊 VWAP with MTF & Dynamic Deviation Bands
Indicatore
ATR
RSI
+5
🚀 HAI QUANTUM v4.0 | The Ultimate Quantum Terminal for cTrader (Smart Money & Algorithmic Trading)
Indicatore
Forex
Crypto
+5
📈 Initial Balance Breakout Signals: visually accurate IB levels, breakout alerts & forecast zones for smart trading.
Indicatore
RSI
RSI on the main chart with 45/55 momentum levels, overbought/oversold levels, averaged RSI, and multi-timeframe support.
Indicatore
SMC
Forex
+4
Identifies institutional zones with Volume Delta (K) across any asset or chart for high-precision entry detection.
Indicatore
Displays the previous day's, last week's, and last month's highest and lowest price levels on your chart.
Indicatore
Drawdown Monitor
Protect your funded account. Real-time Daily Equity Drawdown monitor with Green / Orange / Red flashing alerts.
Indicatore
AI
ATR
+19
Market Cipher A
Indicatore
SMC
VWAP
+4
Killzone Session and key levels with VWAP – Precision Meets Price Action
Indicatore
SMA
Volume
+3
Stoc​h PRO Quad Rotation Signal (QRS) is an advanced technical analysis indicator developed for cTrader.
Indicatore
SMC
Prop
+14
Right-anchored cTrader Volume Profile with VAH/VAL/POC, LVZ, top volume+EMA, themes, and fast, readable visuals.
Indicatore
ATR
EMA
+4
The FULL-MARKET-VIEW-DASHBOARD is a professional-grade trading suite for cTrader that eliminates market noise.
Indicatore
ATR
EMA
+4
Range-filter BUY/SELL signals scored by four confluence layers, with a stop, five targets and a trend panel
Indicatore
Forex
Renko scalping indicator
Indicatore
MACD
Dynamic MACD histogram dots with smart crossing signals for faster momentum analysis.
Indicatore
ATR
RSI
+20
SMC/ICT signals using FVG + liquidity sweep/MSS with EMA-RSI-MACD filters, clear visuals, and actionable alerts.
Indicatore
Risk Dashboard
AI-powered daily range forecasts help traders spot volatility opportunities and plan stops and targets.
Indicatore
ATR
RSI
+5
One of the best indicators we have ever developed, with a very high profit ratio.

Prezzo

Da 21/02/2025
466.3M
Volume negoziato
180.83K
Profitto in pip
26
Vendite
7.45K
Installazioni gratuite