Opis
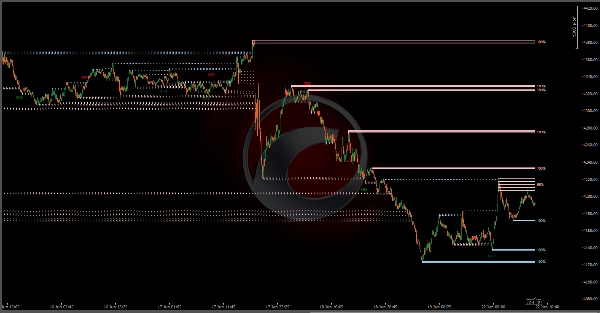
Narzędzie Liquidity Profiler Tools to wskaźnik identyfikujący główne poziomy płynności po stronie kupujących i sprzedających oraz wizualizujący wewnętrzną aktywność kupujących/sprzedających poprzez kwadranty wypełnione deltą wolumenu, zapewniając kompletny zestaw narzędzi do analizy zmiotów płynności i potencjalnych odwróceń.
Wykrywanie
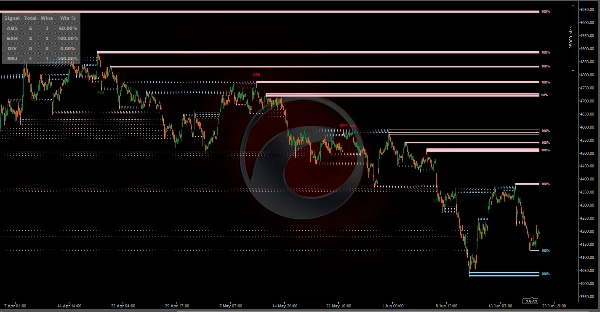
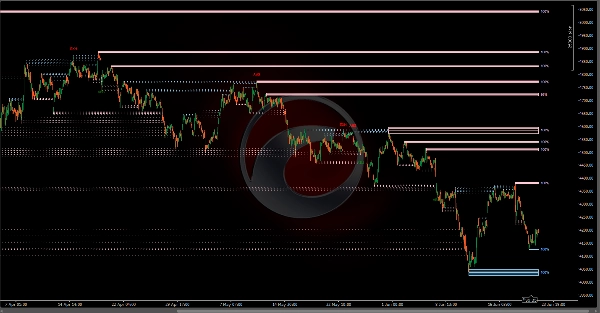
Wskaźnik wykorzystuje system wykrywania oparty na pivotach. Gdy potwierdzony zostanie swing high, tworzona jest strefa płynności po stronie kupujących (BSL); swing low tworzy strefę płynności po stronie sprzedających (SSL). Skrypt zawiera logikę "Filter Overlaps", aby zapewnić czytelność wykresu. Jeśli w zakresie istniejącej aktywnej strefy pojawi się nowy, bardziej znaczący pivot, narzędzie może automatycznie zaktualizować się do najbardziej istotnego poziomu, zapobiegając zagraceniu wykresu wieloma nakładającymi się polami.
To narzędzie dzieli każdą strefę na cztery poziome kwadranty. Gdy cena handluje w tych kwadrantach, skrypt oblicza deltę wolumenu (różnicę między presją kupna a sprzedaży) dla każdej konkretnej sekcji.
Strefy Kupna: Wskazują, że agresywni kupujący byli bardziej aktywni w tym konkretnym fragmencie ceny.
Strefy Sprzedaży: Wskazują, że agresywni sprzedający dominowali w tej sekcji.
Wykrywanie Odwróceń
Skrypt zawiera system wykrywania, który identyfikuje nietypowe wzorce wolumenu podczas zmiotów płynności. Sygnały te są wyświetlane w formie tekstowej w następujący sposób:
-
- ABS (Absorpcja): Występuje, gdy agresywne zlecenia rynkowe na skrajnym brzegu strefy są absorbowane przez duże zlecenia limit w przeciwnym kierunku.
- EXH (Wyczerpanie): Występuje, gdy zmiot następuje przy bardzo niskim względnym wolumenie, sugerując brak kontynuacji.
- DIV (Dywergencja): Identyfikowana, gdy wysoki wolumen popycha do krawędzi strefy (FOMO), ale cena nie zamyka się poza poziomem.
- REJ (Odrzucenie Snapback): Wywoływane, gdy świeca zmiotu pokazuje wysoką deltę w przeciwnym kierunku do zmiotu i zamyka się z powrotem wewnątrz strefy.
Panel Sterowania:
Wskaźnik zawiera panel sterowania w czasie rzeczywistym, który śledzi historyczną skuteczność każdego typu sygnału odwrócenia, wykorzystując logikę walidacji opartą na czasie.
Wygrana jest odnotowywana, jeśli w oknie ewaluacyjnym cena odwraca się od zmiotu i pozostaje na plusie (po właściwej stronie wejścia sygnału) przez określoną liczbę kolejnych świec (czas trzymania).
Degradacja Strefy (Stan):
Aktywne strefy posiadają etykietę procentową "Stanu". Śledzi ona skumulowany wolumen obrotu w strefie w stosunku do jej pojemności. W miarę jak więcej wolumenu jest realizowane na tych poziomach, płynność jest uważana za "zużytą", a procent spada w kierunku 0%.
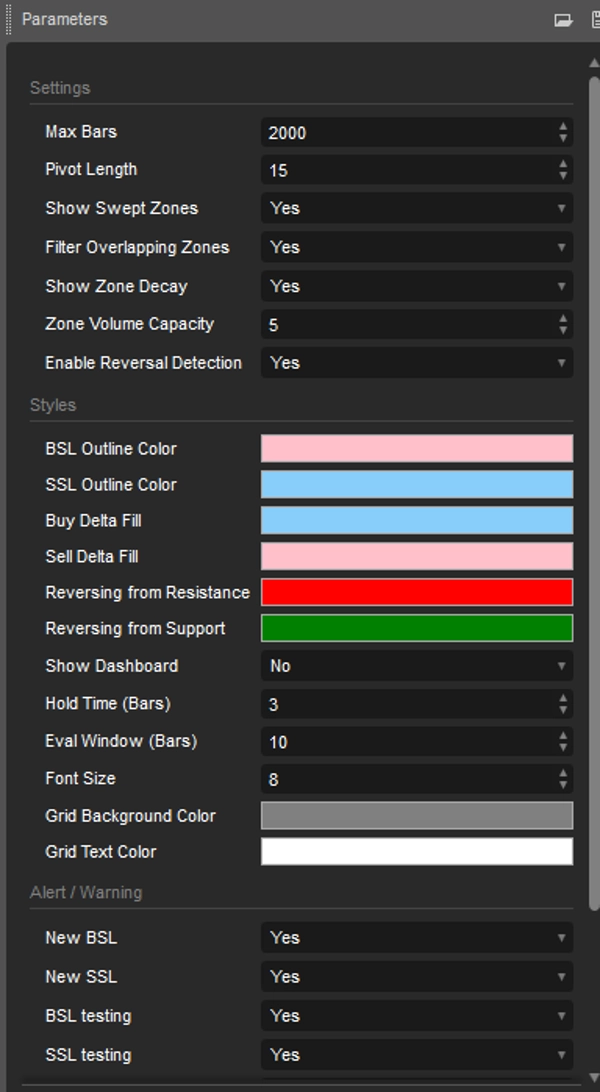
Ustawienia Wskaźnika
Główne Ustawienia
- Długość Pivot: Okres cofnięcia/wyprzedzenia do wykrywania swing high i low.
- Maksymalna liczba świec: Wskaźnik zaczyna obliczenia na podstawie liczby historycznych świec.
- Pokaż Zmiotane Strefy: Utrzymuje widoczność stref z przerywanymi obrysami po ich naruszeniu.
- Filtruj Nakładające się Strefy: Zapobiega tworzeniu nowych stref nakładających się na istniejące aktywne strefy.
Degradacja & Odwrócenia
- Pokaż Degradację Strefy: Przełącza etykiety procentowe stanu.
- Pojemność Wolumenu Strefy: Mnożnik dla średniego wolumenu, aby określić, ile wolumenu strefa może wchłonąć.
- Włącz Wykrywanie Odwróceń: Przełącza dymki sygnałów dla wzorców odwrócenia.
Panel Sterowania
- Pokaż Panel Sterowania: Przełącza tabelę śledzenia wyników.
- Czas Trzymania (świece): Liczba kolejnych świec, przez które cena musi pozostać na plusie, aby odwrócenie zostało uznane za udane.
- Okno Ewaluacji (świece): Maksymalna liczba świec, na które skrypt czeka na manifestację odwrócenia.
Style i Alerty
- Style: Konfiguracja kolorów obiektów. Ukryj/Pokaż Panel Sterowania.
- Alert: Włącz/wyłącz alerty za każdym razem, gdy wykrywane/migrowane/testowane/odwracane są BSL i SSL.
Podsumowanie
The tool also detects potential reversal signals during liquidity sweeps, displaying four types of volume-based patterns: Absorption (ABS), Exhaustion (EXH), Divergence (DIV), and Snapback Rejection (REJ). These signals help identify unusual volume behavior that may precede price reversals.
A real-time dashboard tracks the historical performance of reversal signals, validating them based on price action within a user-defined evaluation window and hold time. Active zones feature a "Health" metric indicating the extent of volume consumed relative to zone capacity, reflecting liquidity depletion.
Users can customize settings including pivot length, volume capacity, zone visibility, reversal detection toggles, and dashboard display. The indicator supports visualization of liquidity sweeps and reversals, aiding analysis of support and resistance levels through volume and order flow insights.