
KANDIKA HEAT MAP
Indicatore
1 acquisti
Versione 1.0, Jul 2025
Windows, Mac
4.6
Recensioni: 3
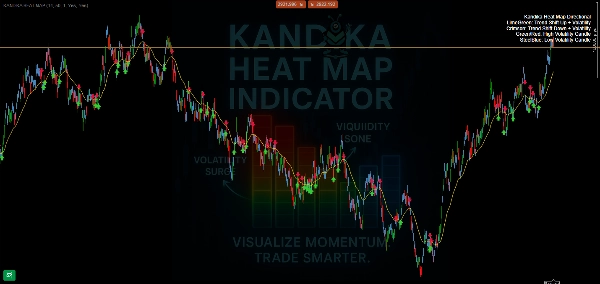
🎨 Logica del Colore – Cosa Ti Dice
- 🟩 Verde Lime → Inversione di Tendenza Rialzista
Si sta formando un cambiamento di momentum rialzista. Usalo per cogliere i primi rialzi. - 🟥 Cremisi → Inversione di Tendenza Ribassista
Segnala una pressione al ribasso in aumento. Ti prepara per potenziali posizioni short o uscite. - 🟧/🔴 Arancione/Rosso → Zona di Alta Volatilità
Aspettati picchi di prezzo, movimenti rapidi e potenziali trappole. Non è un luogo per indovinare alla cieca—conferma la tua strategia. - 🟦 Blu Acciaio → Zona di Bassa Volatilità
Il mercato rallenta, si comprime o si muove lateralmente. Spesso prepara opportunità di breakout.
📊 Cosa Fa (E Cosa Non Fa)
- ✅ Mappa chiaramente i cambiamenti di direzione della tendenza
- ✅ Separa visivamente le zone calme da quelle volatili
- ✅ Sovrapposizione semplice e adatta ai grafici—senza ingombri
Profilo indicatore
4.6
Recensioni: 3
5 | 67 % | |
4 | 33 % | |
3 | 0 % | |
2 | 0 % | |
1 | 0 % |
Recensioni dei clienti
August 4, 2025
No reason to yolo this live without a few normal sessions, and Bad settings can ruin the idea.
July 26, 2025
20 percent less clicking is the line to watch. Market checks feel quicker.
I prodotti disponibili tramite cTrader Store, inclusi bot di trading, indicatori e plugin, sono forniti da sviluppatori terzi e resi disponibili esclusivamente a scopo informativo e di accesso tecnico. cTrader Store non è un broker e non fornisce consulenze in materia di investimento, raccomandazioni individualizzate o garanzie di risultati futuri.


Da 08/06/2025
1
Vendite