
说明
该指标旨在使用四个自变量进行多元非线性回归分析:收盘价、开盘价、最高价和最低价。
以下是组件和功能:
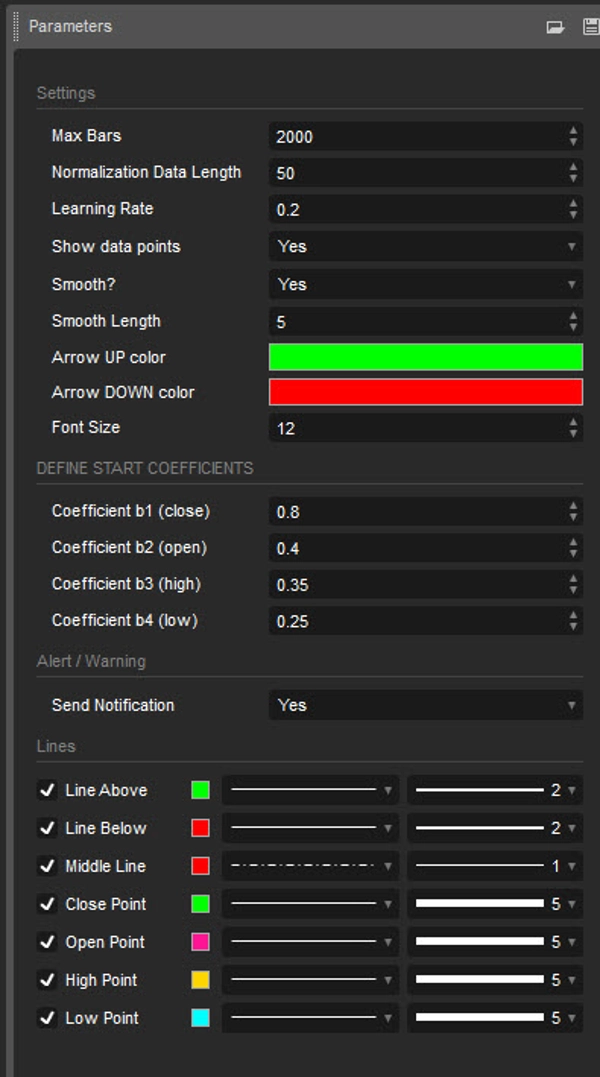
输入:
- 归一化数据长度:用于归一化的数据长度。
- 学习率:算法从错误中学习的速率。
- 显示数据点:显示归一化输入数据(收盘价、开盘价、最高价、最低价)的绘图。
- 平滑?:输出平滑的选项。
- 平滑长度:启用时的平滑长度。
- 定义起始系数:回归方程的初始系数。
数据归一化:
脚本使用指定长度内的最高值和最低值将输入数据归一化到0到1的范围内。
非线性回归:
它使用输入的系数和归一化数据计算回归方程。所用方程是自变量的加权和,系数通过梯度下降法迭代调整以最小化误差。
误差计算:
脚本计算实际值与预测值之间的误差。
梯度下降:
系数通过梯度下降法迭代更新以最小化误差。
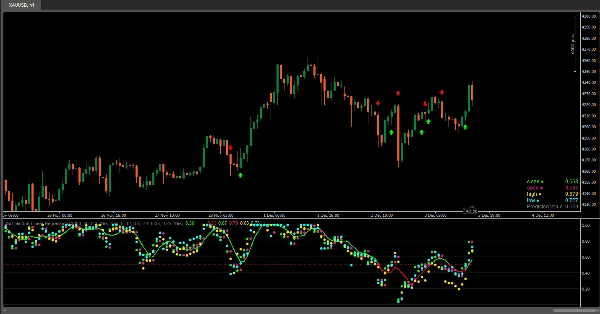
可视化:
- 归一化输入数据(收盘价、开盘价、最高价、最低价)的绘图。
- 该指标以图表上的圆形标记形式提供归一化数据值(收盘价、开盘价、最高价、最低价)的可视化,方便用户轻松观察这些值相互之间及与回归线的相对位置。
- 回归线的绘制。
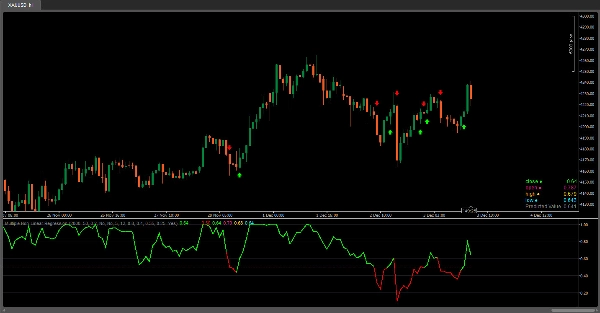
- 基于回归线的值和柱状颜色的颜色渐变。
- 以表格形式显示归一化输入数据和预测值。
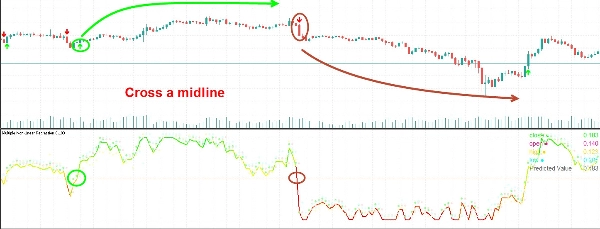
- 与中线(0.5)交叉的信号。
解释:
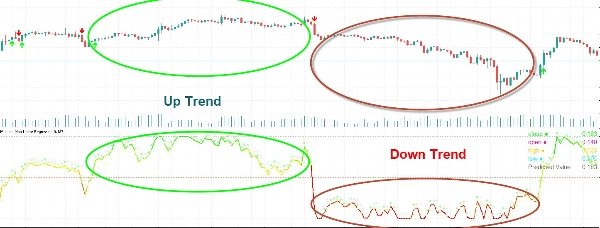
用户可以将回归线及其与中线(0.5)的交叉视为潜在买入或卖出机会的信号。
该指标帮助用户分析多个变量之间的关系,并基于回归分析做出交易决策。调整系数和参数可以根据特定市场条件微调模型性能。
摘要
指标配置
客户评价
5.0
评价:1
5 | 100 % | |
4 | 0 % | |
3 | 0 % | |
2 | 0 % | |
1 | 0 % |
讨论
常见问答
BTCUSD
Forex
Signal
Crypto
XAUUSD
NAS100
cTrader Store 提供的所有产品,包括交易机器人、指标和插件,均由第三方开发者提供,仅供信息参考和技术访问之用。cTrader Store 并非经纪商,不提供投资建议、个人推荐或任何未来业绩保证。
该作者的其他作品


猜您喜欢
!["[Hamster-Coder] Bollinger Bands" 标识](https://cdn.ctrader.com/image/webp/21d8e5d6-fb11-4bac-b9ee-cd05c2b76804_30327)


价格
38
销售
2.39K
免费安装