
说明
简单的 ICT 概念指标是一个强大的工具,旨在帮助交易者应用内圈交易者(ICT)方法论的原则。该指标专注于识别关键区域,如流动性水平、支撑和阻力以及市场结构,使其成为价格行为和智能资金概念交易者的宝贵资产。
主要特点
市场结构:
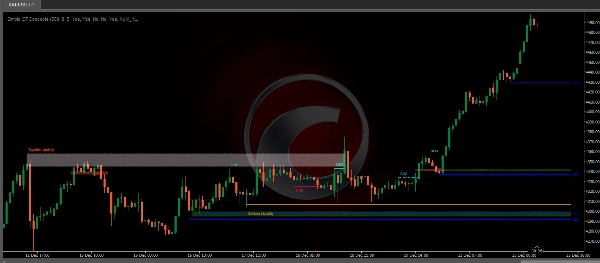
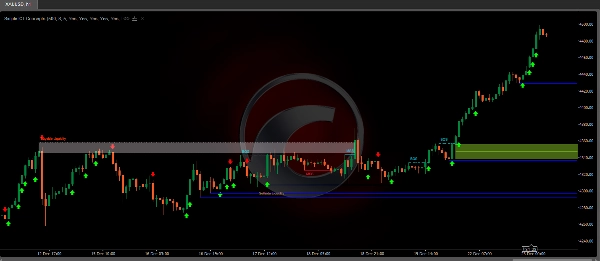
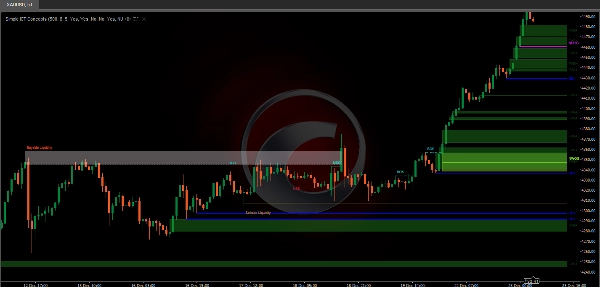
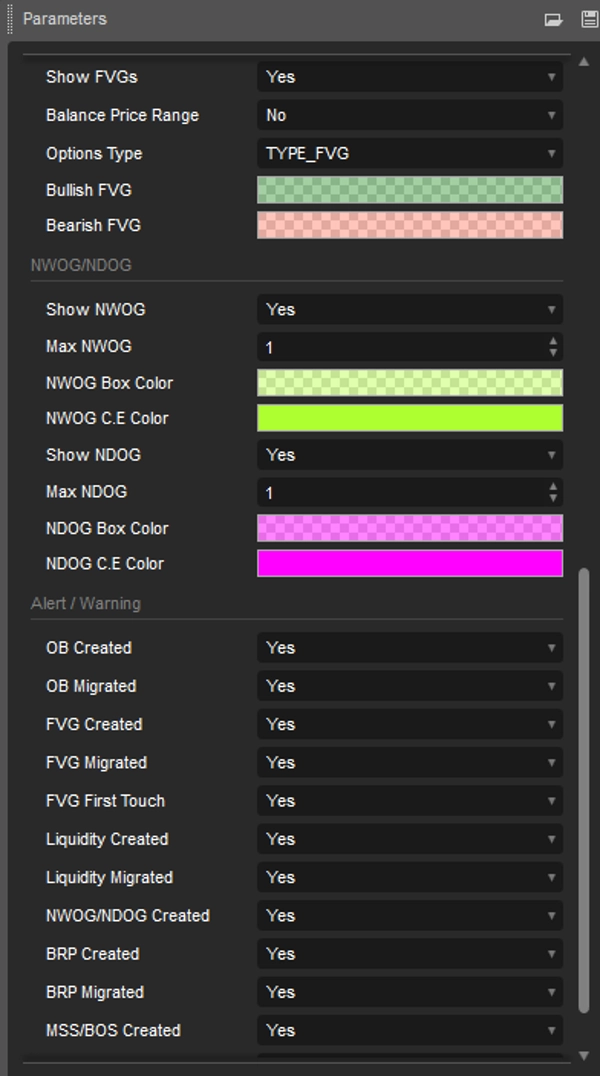
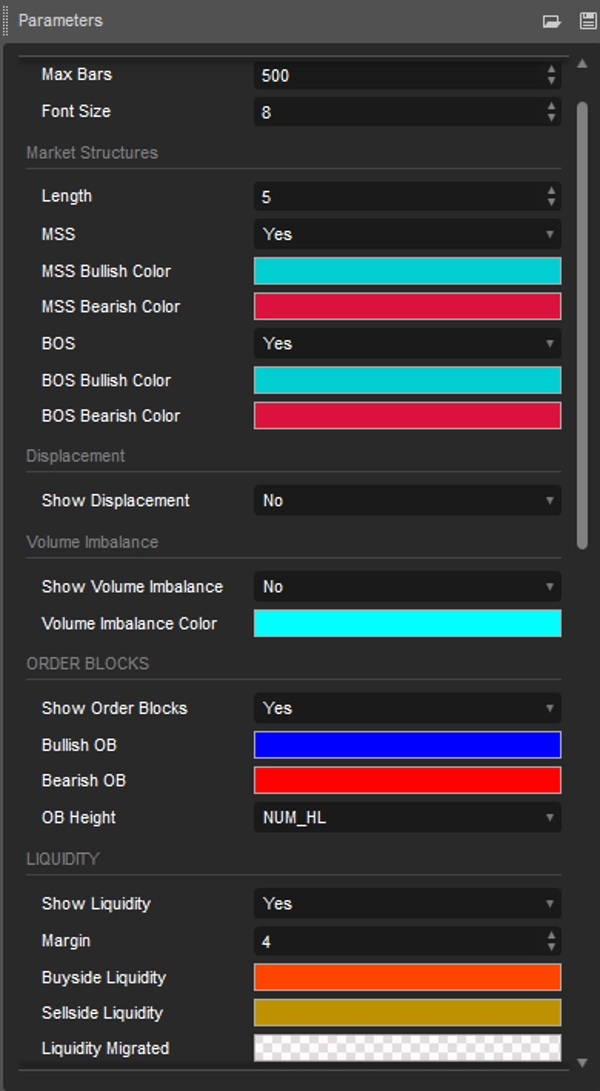
市场结构标签是由价格突破先前的摆动点构建的。这使用户能够根据价格行为确定当前的市场趋势。包含两种类型的市场结构标签:市场结构转变(MSS)结构突破(BOS)当价格在上升趋势中突破摆动低点或在下降趋势中突破摆动高点时,会发生 MSS,突出显示潜在的反转。这通常被标记为“CHoCH”,但 ICT 将其指定为 MSS。另一方面,BOS 标签发生在价格在上升趋势中突破摆动高点或在下降趋势中突破摆动低点时。这些特定摆动点的出现是由回撤(诱导)引起的,突出显示了低时间框架中的流动性狩猎。关键摆动点:更高的高点(HH)和更低的低点(LL),更高的低点(HL)和更低的高点(LH)位移:位移是指价格形成连续的同一情绪(看涨/看跌)的大实体和短影线的烛台的情形。这些可以通过正自相关(收盘到开盘的变化更可能跟随同号变化)以及波动聚集(大变化后跟随大变化)更技术性地识别。位移可能导致不平衡和市场结构的形成,这些可能是由元订单的完全执行引起的。成交量不平衡:成交量不平衡(V.I.)发生在价格区域内没有烛台实体的地方。烛芯有上下波动,但由于成交量主要集中在烛台实体中,我们称之为成交量不平衡。订单区块:ICT(内圈交易者)订单区块是图表上大型机构投资者下达大量买卖订单的价格区域。订单区块是交易中的关键概念,因为它们可以帮助交易者识别潜在的支撑和阻力水平,并预测价格反转。流动性:买方/卖方流动性水平突出显示市场参与者可能下达限价/止损订单的价格水平。买方流动性水平将汇集空头交易者的止损订单以及多头交易者的限价订单,而卖方流动性水平将汇集多头交易者的止损订单以及空头交易者的限价订单。这些水平可以扮演不同的角色。更有信息的市场参与者可能将这些水平视为流动性来源,一旦特定水平上的流动性减少,它将在另一个区域被发现。FVG/IFVG:公平价值缺口:三根烛台形成,其中中央烛台相邻的烛芯不重叠,突出显示缺口区域。隐含公平价值缺口:与公平价值缺口不同,隐含公平价值缺口的中央烛台相邻烛芯重叠。缺口区域由相应烛芯与其烛台实体最近端点之间的平均值构成。平衡价格区间:当一个公平价值缺口与之前的公平价值缺口重叠时,重叠区域形成不平衡区域,称为平衡价格区间。NWOG/NDOG:该指标显示新周开盘缺口(NWOG)和新日开盘缺口(NDOG)。NWOG 是周五收盘价与周日开盘价之间的缺口。NDOG 是前一日开盘价与收盘价之间的缺口。
可定制功能
用户可以调整数据长度、颜色和显示样式等设置,以匹配他们的交易偏好。
交易者的好处
节省手动分析时间,提高交易效率。
帮助在波动的市场条件下快速做出明智的决策。
对初学者和有经验的交易者都易于使用。
结论
简单的 ICT 概念指标不仅是一个工具,更是寻求有效实施 ICT 策略的交易者的综合解决方案。它是增强市场分析和执行精准交易的强大选择。
摘要
AI 摘要
The Simple ICT Concepts Indicator is a technical analysis tool designed to assist traders in applying the Inner Circle Trader (ICT) methodology. It identifies key market zones including liquidity levels, support and resistance, and market structure to support price action and smart money concept trading. The indicator labels market structure shifts (MSS) and breaks of structure (BOS) based on swing point breaks, helping users determine current market trends. It detects displacements characterized by successive candles with strong directional sentiment, volume imbalances where candle bodies leave gaps, and order blocks representing institutional buy or sell zones. The tool highlights buy-side and sell-side liquidity levels, indicating where stop-loss and limit orders cluster. It also identifies fair value gaps (FVG), implied fair value gaps (IFVG), balanced price ranges, and new week/day opening gaps (NWOG/NDOG). Users can customize settings such as data length, colors, and display styles to fit their trading preferences. The indicator aims to save time on manual analysis and facilitate quick, informed decisions in volatile markets. It is suitable for both beginners and experienced traders seeking to implement ICT strategies effectively across markets including Forex, cryptocurrencies, and indices like BTCUSD, XAUUSD, and NAS100.
指标配置
客户评价
4.0
评价:1
5 | 0 % | |
4 | 100 % | |
3 | 0 % | |
2 | 0 % | |
1 | 0 % |
客户评价
December 27, 2025
The signal still needs a chart check, no surprise there. One green trade proves nothing.
讨论
常见问答
BTCUSD
Forex
Signal
Fair Value Gap
Crypto
XAUUSD
NAS100
cTrader Store 提供的所有产品,包括交易机器人、指标和插件,均由第三方开发者提供,仅供信息参考和技术访问之用。cTrader Store 并非经纪商,不提供投资建议、个人推荐或任何未来业绩保证。
该作者的其他作品


猜您喜欢


!["Gaussian Channel [Iridio Capital]" 标识](https://cdn.ctrader.com/image/webp/7c039209-5573-4a54-a072-f9528b503103_41960)


价格
38
销售
2.39K
免费安装