
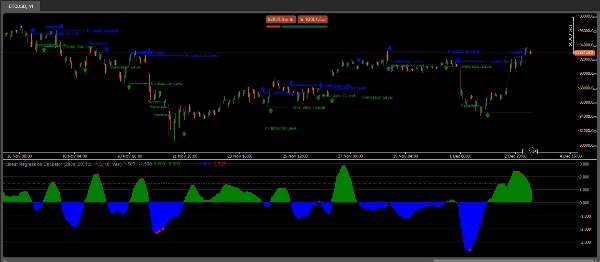
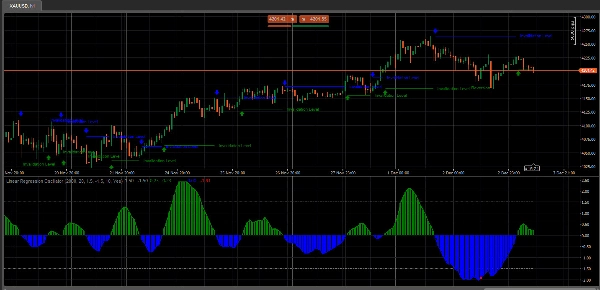
线性回归振荡器(LRO)是一种基于线性回归分析的技术指标,常用于金融市场中评估价格趋势的动量和方向。它测量当前价格与线性回归线预测值之间的距离,线性回归线本质上是在指定期间内的最佳拟合线。以下是其工作原理及组成部分的详细说明:
线性回归振荡器的关键组成部分
- 线性回归线(最佳拟合线):这条线表示在一定时期内预期的价格走势,使用线性回归技术计算得出。线的斜率表示趋势方向:正斜率表示上升趋势,负斜率表示下降趋势。
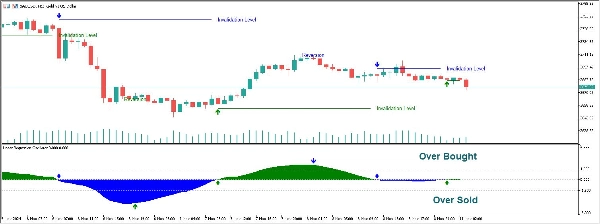
- 振荡器数值:振荡器数值通过测量当前价格与线性回归线之间的偏差计算得出。该偏差作为振荡器数值绘制,通常围绕零线波动。
- 零线:LRO图中的零线作为基线。当振荡器数值穿越零线上方时,表明看涨动量;穿越零线下方时,表明看跌动量。
- 设置和周期:周期设置定义了用于计算线性回归线的柱数或数据点数。交易者根据其偏好的分析时间框架调整此设置,以适应短期或长期交易策略。
交易者如何使用线性回归振荡器
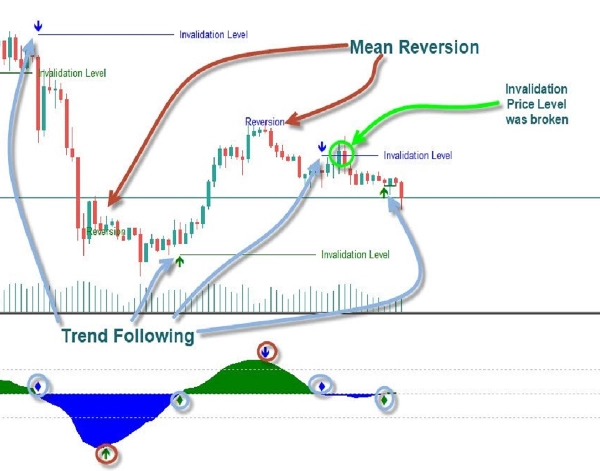
- 识别趋势:LRO帮助交易者观察当前价格趋势是否具有动量,通过显示价格与其预期(回归)线之间的相对距离。
- 超买/超卖水平:振荡器的极端数值可以指示超买或超卖状态,暗示可能的反转或需要调整仓位。
- 背离信号:当价格走势与LRO指标出现背离时,可能预示动量减弱或潜在反转。
解读提示
- 穿越零线:穿越零线向上可能表示新兴的上升趋势,穿越零线向下则表示下降趋势。
- 调整周期:较短的周期使LRO更敏感,能捕捉快速价格变动,但噪音也增加。较长的周期平滑波动,适合识别长期趋势。
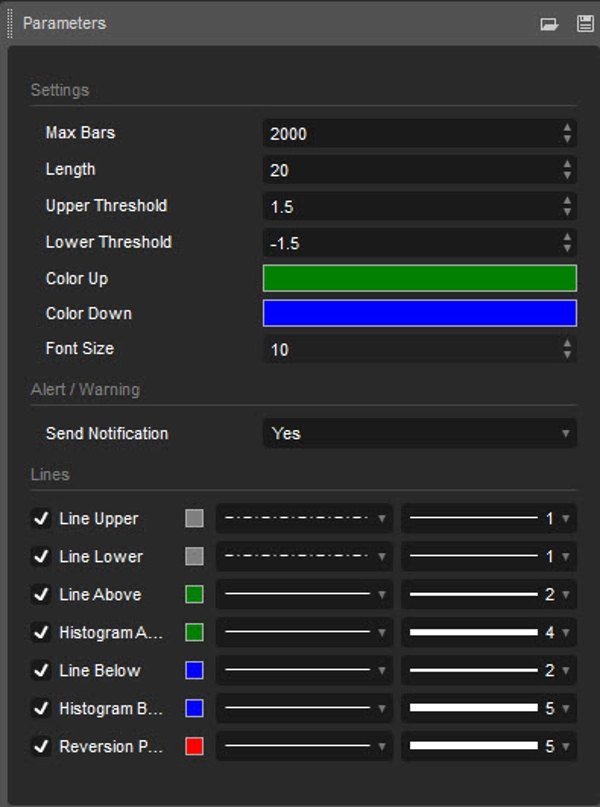
使用说明:
- 周期长度:决定计算线性回归的周期长度
- 上下阈值:定义识别超买和超卖状态的上下界限。超出这些阈值的数值暗示潜在反转。
线性回归振荡器因结合了统计分析与趋势跟踪原理而备受重视,使其成为动量和趋势交易者的多功能工具。它在趋势市场中特别有用,帮助基于回归趋势线的偏差识别趋势延续或反转。
指标配置
4.0
评价:1
5 | 0 % | |
4 | 100 % | |
3 | 0 % | |
2 | 0 % | |
1 | 0 % |
客户评价
December 12, 2025
Demo first, then maybe small size if the notes look sane. The setup needs patience.
BTCUSD
Forex
Signal
Crypto
XAUUSD
NAS100
cTrader Store 提供的所有产品,包括交易机器人、指标和插件,均由第三方开发者提供,仅供信息参考和技术访问之用。cTrader Store 并非经纪商,不提供投资建议、个人推荐或任何未来业绩保证。
该作者的其他作品


36
销售
2.23K
免费安装