
说明
公平价值缺口(FVG)指标
概述
公平价值缺口(FVG)指标 识别价格行为中的低效区域,这些区域由于激进的买入或卖出而产生不平衡。这些缺口通常由机构交易者和聪明资金制造,留下价格可能随后回归“填补”不平衡区域的空间,然后继续其趋势。
主要特点:
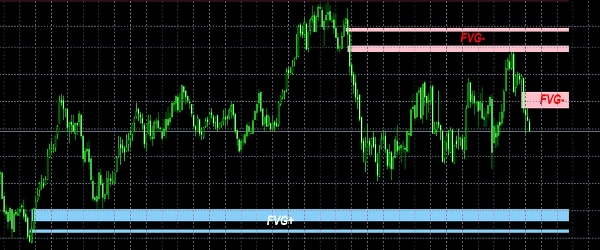
- 自动检测FVG – 指标突出显示不同时间框架中的公平价值缺口。
- 多时间框架支持 – 在较低时间框架图表上查看较高时间框架的FVG。
工作原理:
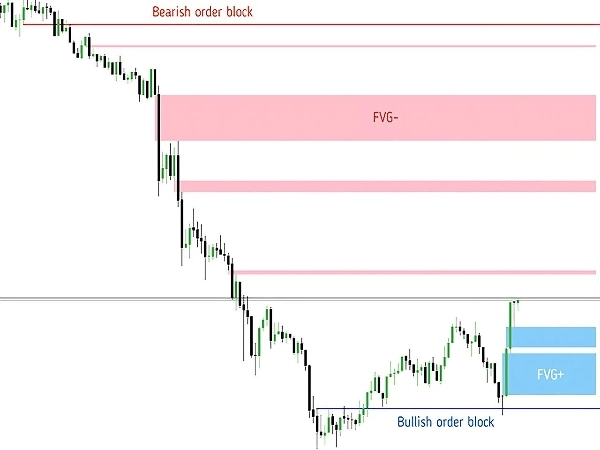
- 指标扫描价格走势,检测蜡烛的 最高价 未与前方两根蜡烛的 最低价重叠的缺口(看涨FVG),反之亦然(看跌FVG)。
- 这些区域被标记为潜在的流动性区域,价格可能会在继续主导趋势之前回访。
- 指标帮助交易者识别 聪明资金的足迹,结合FVG与BOS、CHoCH和订单区块。
如何使用FVG进行交易:
- 入场策略: 等待价格回归并对FVG区域作出反应(拒绝、支撑或阻力)。
- 汇聚交易: 结合 BOS、订单区块和流动性清扫 以提高准确性。
- 获利目标: 考虑下一个流动性池或主要结构水平。
谁应该使用此指标?
- 聪明资金和ICT交易者
- 价格行为和机构交易者
- 短线交易者和波段交易者
摘要
AI 摘要
The Fair Value Gap (FVG) Indicator detects price action inefficiencies caused by aggressive buying or selling, often linked to institutional traders. It automatically identifies fair value gaps—areas where a candle’s high does not overlap with the low of two candles ahead (bullish FVG) or vice versa (bearish FVG)—across multiple timeframes, allowing users to view higher timeframe gaps on lower timeframe charts. These gaps represent potential liquidity zones where price may revisit before continuing its trend. The indicator helps traders recognize smart money footprints by combining FVG analysis with Break of Structure (BOS), Change of Character (CHoCH), and Order Blocks. Trading strategies using this indicator involve waiting for price reactions at FVG zones for entry, using confluence with other smart money concepts for accuracy, and targeting subsequent liquidity pools or major structure levels for take profit. It is suitable for smart money, ICT, price action, institutional traders, scalpers, and swing traders operating in markets including Forex, Crypto, and indices such as BTCUSD, EURUSD, XAUUSD, and NAS100.
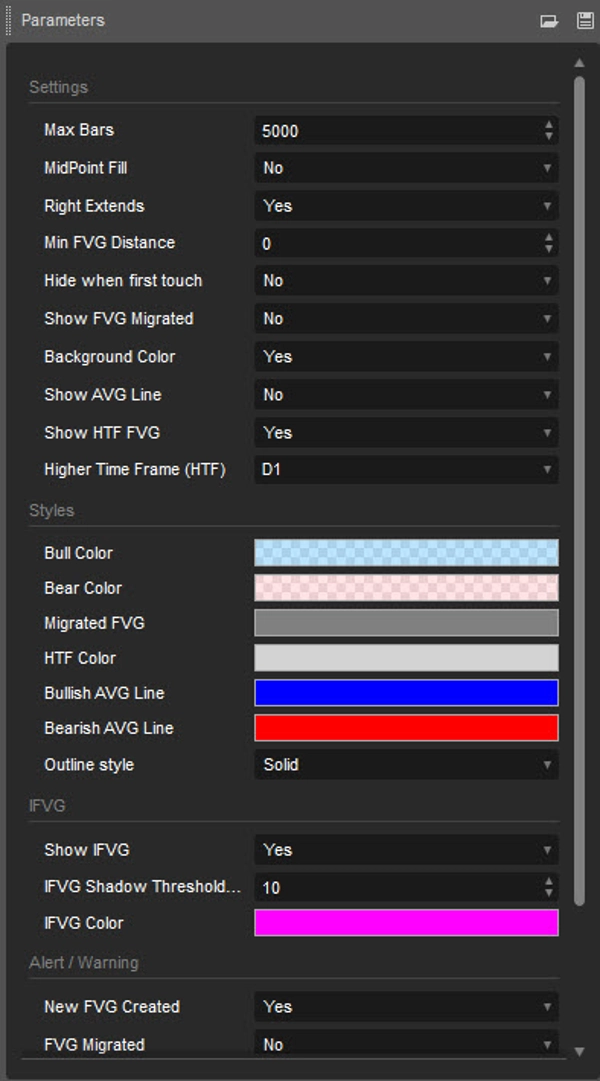
指标配置
客户评价
5.0
评价:1
5 | 100 % | |
4 | 0 % | |
3 | 0 % | |
2 | 0 % | |
1 | 0 % |
客户评价
December 10, 2025
A clean and accurate Fair Value Gap detector. Highlights bullish/bearish FVGs with minimal lag and great clarity. Useful for intraday and swing ICT/SMC setups. Can get busy on lower TFs, but filtering helps. Alerts, MTF mode and FVG state tracking would take it to the next level.
讨论
常见问答
BTCUSD
Forex
Scalping
EURUSD
Fair Value Gap
SMC
Crypto
XAUUSD
NAS100
cTrader Store 提供的所有产品,包括交易机器人、指标和插件,均由第三方开发者提供,仅供信息参考和技术访问之用。cTrader Store 并非经纪商,不提供投资建议、个人推荐或任何未来业绩保证。
该作者的其他作品


!["[Hamster-Coder] Bollinger Bands" 标识](https://cdn.ctrader.com/image/webp/21d8e5d6-fb11-4bac-b9ee-cd05c2b76804_30327)


价格
38
销售
2.35K
免费安装