
Beschreibung
Quantitative Qualitative Estimation (QQE) Multi-Timeframe Indikator
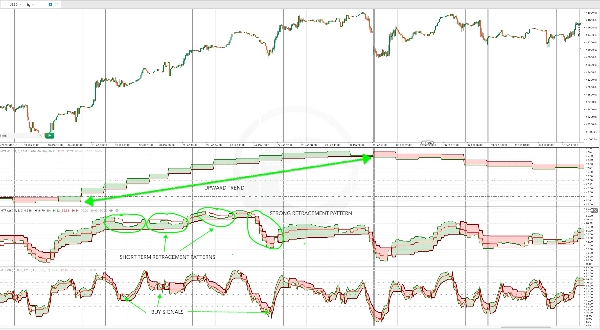
Der Quantitative Qualitative Estimation (QQE) Indikator ist ein Werkzeug der technischen Analyse, das den Relative Strength Index (RSI) durch die Einbeziehung geglätteter gleitender Durchschnitte verbessert. Er hilft Händlern, Trendstärke, potenzielle Umkehrungen und überkaufte/überverkaufte Zustände genauer zu beurteilen.
QQE verfügt über zwei Hauptkomponenten: die schnellen und langsamen Trailing-Stop-Niveaus, die als dynamische Unterstützung und Widerstand fungieren. Dies macht ihn zu einem vielseitigen Werkzeug für sowohl Trendfolge- als auch Mean-Reversion-Strategien. Ein Kreuzungspunkt zwischen der QQE-Linie und ihrer Signallinie weist oft auf potenzielle Kauf- oder Verkaufsgelegenheiten hin.
Multi-Timeframe QQE: Eine erweiterte Version
Diese verbesserte Version des QQE-Indikators ist als Multi-Timeframe-Werkzeug konzipiert, das sowohl schnelle als auch langsame Trendlinien für eine verbesserte Präzision integriert. Durch die Analyse der Kursbewegung über mehrere Zeitrahmen hinweg bietet sie eine umfassende Sicht auf Markttrends.
Ihr fortschrittlicher Glättungsalgorithmus erhöht die Zuverlässigkeit und macht sie zu einem effektiven eigenständigen Indikator für:
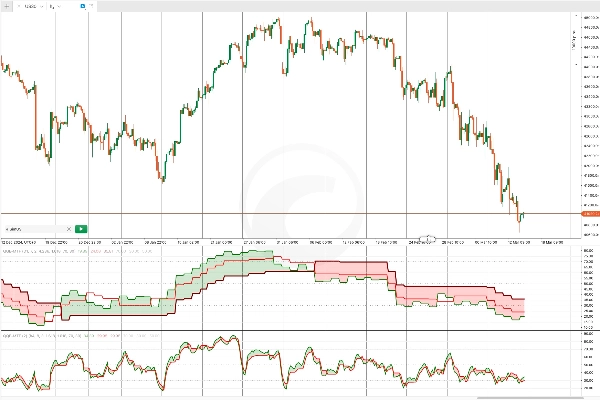
✅ Erkennung der Trendrichtung
✅ Generierung präziser Ein- und Ausstiegssignale
✅ Erkennung von überkauften und überverkauften Zuständen
Die Flexibilität des Multi-Timeframe QQE macht ihn sowohl für Trendfolge- als auch Umkehrstrategien geeignet.
Wie man den Multi-Timeframe QQE verwendet
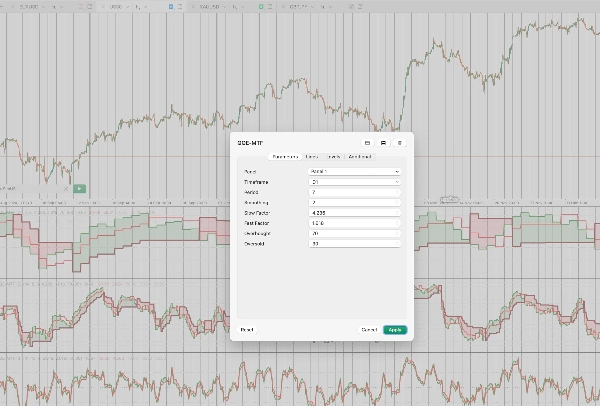
Um den Multi-Timeframe QQE zu konfigurieren, müssen Händler auswählen:
🔹 Einen Zeitrahmen (z. B. Daily, H4, H1)
🔹 Perioden (Anzahl der Kerzen, die in die Berechnung einfließen)
🔹 Eine Glättungsperiode (für die RSI-Glättung)
🔹 Langsame und schnelle Faktoren (zur Anpassung der Empfindlichkeit)
🔹 Anpassbare überkaufte und überverkaufte Niveaus
📌 Hinweis: Da es sich um einen Multi-Timeframe-Indikator handelt, ist es nach dem Hinzufügen zum Chart wichtig, in der cTrader-Oberfläche herauszuzoomen, um genügend Daten zu laden und den Indikator korrekt zu initialisieren.
Handelsstrategien mit Multi-Timeframe QQE
1️⃣ QQE zur Bestätigung von Trends in höheren Zeitrahmen
Eine effektive Methode, den Multi-Timeframe QQE zu nutzen, ist die Trendbestätigung in einem höheren Zeitrahmen, während man Einstiege bei Rücksetzern in einem niedrigeren Zeitrahmen identifiziert.
Zum Beispiel:
- Der QQE im Tageszeitrahmen wird verwendet, um einen starken Trend zu bestätigen.
- Rücksetzeinstiege werden dann identifiziert, wenn der Stochastische Oszillator die überkauften oder überverkauften Niveaus kreuzt.
Diese Methode hilft Händlern, ihre Einstiege mit dem übergeordneten Trend in Einklang zu bringen.
2️⃣ Multi-Timeframe-Analyse für tiefere Markteinblicke
Die Verwendung des QQE über mehrere Zeitrahmen ermöglicht es Händlern, ein detaillierteres Verständnis des Verhaltens eines Assets zu gewinnen.
Zum Beispiel durch Anwendung des QQE auf:
📊 Tageszeitrahmen (D1): Bestimmt die allgemeine Trendrichtung.
📊 4-Stunden-Zeitrahmen (H4): Bestätigt die Trendrichtung und identifiziert kurzfristige Rücksetzer.
📊 1-Stunden-Zeitrahmen (H1): Generiert präzise Einstiegssignale basierend auf überkauften/überverkauften Zuständen oder Gegen-Trend-Bewegungen.
Dieser strukturierte Ansatz verbessert die Handelszeitpunktbestimmung und Entscheidungsfindung, indem Signale über verschiedene Zeitrahmen hinweg abgestimmt werden.
Zusammenfassung
This advanced multi-timeframe tool integrates fast and slow trend lines to analyze price action across different timeframes, providing a comprehensive view of market trends. Its smoothing algorithm improves reliability, making it effective for identifying trend direction, generating precise entry and exit signals, and detecting overbought/oversold levels.
Users configure the indicator by selecting a timeframe (e.g., Daily, H4, H1), periods for calculation, smoothing period for RSI, sensitivity factors, and customizable overbought/oversold thresholds. It is recommended to zoom out in the cTrader interface after adding the indicator to allow sufficient data loading.
Typical strategies include using the QQE on higher timeframes for trend confirmation and on lower timeframes for entry timing, as well as multi-timeframe analysis to enhance trade timing and decision-making by aligning signals across timeframes.
Kundenbewertungen
5 | 50 % | |
4 | 50 % | |
3 | 0 % | |
2 | 0 % | |
1 | 0 % |


