present
Registrieren Sie sich und erhalten Sie $50 Rabatt auf Ihren ersten Kauf
Trading product for AW Multi Data Indikator, image 1
AW Multi Data
5.62K
Kostenlose Installationen

Beschreibung

Zusammenfassung

KI-Zusammenfassung
AW Multi Data is a trading indicator that displays key trading metrics directly on your chart. It shows the current symbol and timeframe, daily net profit percentage, daily net profit amount, and spread. The indicator requires the timezone to be set to UTC to accurately reflect daily profit values. This tool provides real-time performance data to assist traders in monitoring their trades within the charting interface.
Indikatorprofil

Diskussion

Kundenbewertungen

0.0
Bewertungen: 0
Kundenbewertungen
Bisher gibt es keine Bewertungen für dieses Produkt. Haben Sie es schon ausprobiert? Dann können Sie die erste Person sein, die andere darüber informiert!

Häufig gestellte Fragen (FAQ)

Über den cTrader Store verfügbare Produkte, einschließlich Handelsbots, Indikatoren und Plugins, werden von externen Entwicklern bereitgestellt und nur zu Informations- und technischen Zugriffszwecken verfügbar gemacht. cTrader Store ist kein Broker und erbringt keine Anlageberatung, persönlichen Empfehlungen oder eine Garantie für zukünftige Performance.

Mehr von diesem Autor

with this indicator you could see other time frame candle in your chart.
show spread on chart
some user add moving average to macd to see better. in ctrader 4.3.11 there is a problem with this . I make a macd tha
this indicator show macd on chart.
Multi Time Frame Moving Average is a powerful and flexible indicator for cTrader
 this moving include everything that a trader needs from Moving Average.
this indicaotr show distance between Tenkan to Kijun, Close to Kijun and Close to Tenkan 
Add Slowing to IR Moving Average.
IR Candle Open plots customizable opening price lines for daily, weekly, and monthly candles
Coral indicator
you could put your check list in your chart you could split your test with “,” you could put your checklist in indicat
this indicator show other time frame close in lower time frame. for ex: show daily close in m 15.

Das könnte Sie auch noch interessieren

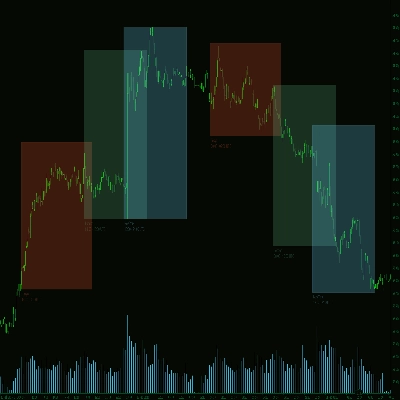
Track major trading sessions (Tokyo, London, New York) with customizable colors and visual session highlights on your ch
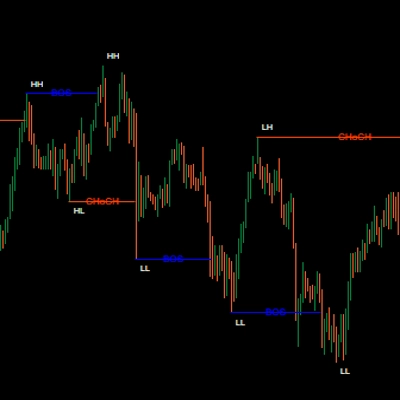
MarketStructurePro – Smart BOS/CHoCH
„DrbcLevels“-Logo
4.0
(4)
$19
/
$29
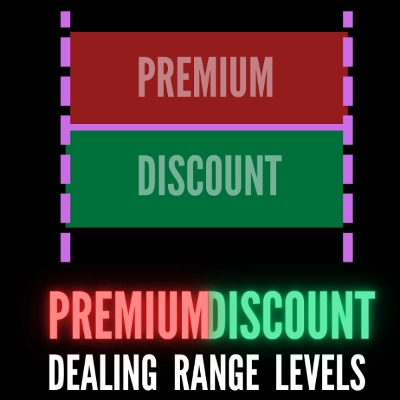
Premium Discount Levels - Professional Dealing Range Zones with Draggable Lines, Alerts, Wartermark & Backtest Mode.
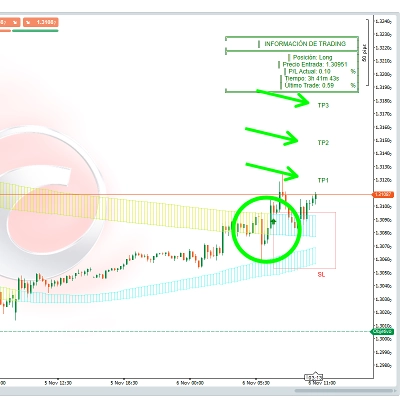
🎯Smart Signals : Auto Buy/Sell alerts with dynamic TP/SL algorithm. 💡
Professional Fair Value Gaps with multitimeframe spot on
Multi VWAP. Three timeframes. One clean chart. Your Essential Trading Tool.
Session Volume Profile for London and New York sessions showing POC levels
Unlock Stochastic RSI PRO in cTrader! Overlay RSI, highlight zones, and identify divergences with customizable settings.
This is an indicator that can alert you about trendlines, horizontal lines and vertical lines.
Camarilla — a precise, non-repainting pivot indicator for cTrader.
🚀 Automated Elliott Wave & Fibonacci tool for cTrader. Spot trends, corrections & retracements fast.
Breakout Channels automatically detects consolidation ranges and highlights when price breaks out of them.
Instantly spot high-liquidity institutional moves with clean, non-obtrusive triangle alerts on cTrader charts.
Average Cost Price helps you keep track of your open positions on the chart. In doing so, it provides lines and explanat
100% Non-Repainting Buy & Sell Signal indicator with Entry, Stop Loss, and Target levels for cTrader traders.
VWAP is a powerful tool for intraday traders
Market structure with BOS and CHoCH, order blocks, and retest buy/sell arrows with entry, stop and two targets
AI-powered daily range forecasts help traders spot volatility opportunities and plan stops and targets.

Preis

5.62K
Kostenlose Installationen