present
Sign up and get $50 off your first purchase
Trading product for Session Volume Profile London NY Indicator Key Levels Volume, image 1
Session Volume Profile London NY
Indicator
Version 1.0, Oct 2026
Windows, Mac
Trading product for Session Volume Profile London NY Indicator Key Levels Volume, image 2
Trading product for Session Volume Profile London NY Indicator Key Levels Volume, image 3
353.2M
Traded volume
2.78K
Pips won
31
Free installs

Description

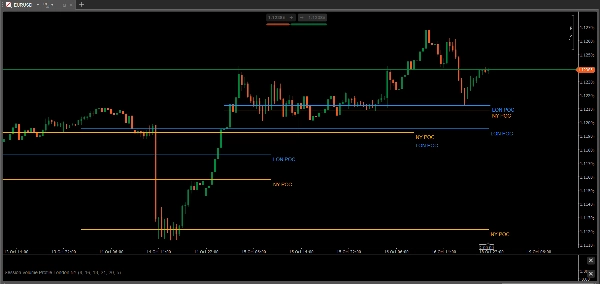
Session Volume Profile London NY displays the Point of Control (POC) for the London and New York sessions.


How it works:

- Calculates volume profile based on Tick Volume for each session

- London session: 08:00 - 16:00 UTC (adjustable)

- New York session: 13:00 - 21:00 UTC (adjustable)

- Draws POC as a horizontal trend line for the last 5 days

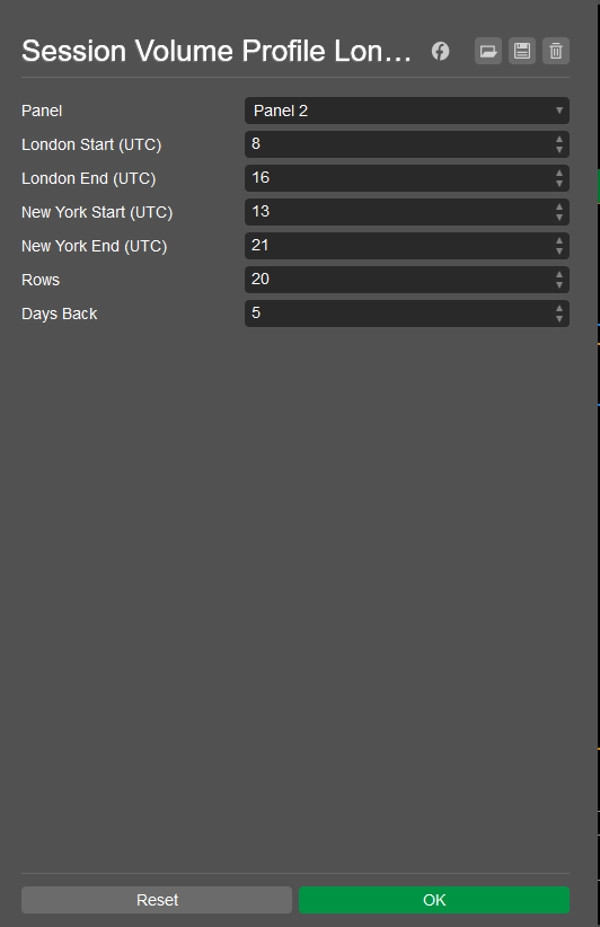
- Rows parameter controls profile resolution


Parameters:

- London Start / End (UTC)

- New York Start / End (UTC)

- Rows (10-100, default 20)

- Days Back (1-30, default 5)


Use:

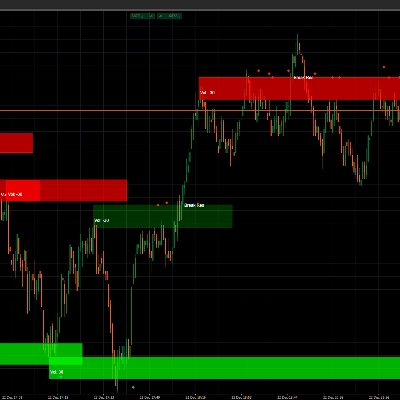
POC levels are often used as intraday support and resistance. Blue lines = London POC, Orange lines = New York POC.


This indicator is for informational purposes only. It does not provide financial advice or guarantee future results.

Summary

AI summary
Session Volume Profile London NY is a trading indicator that calculates and displays the Point of Control (POC) levels for the London and New York trading sessions. It uses tick volume data to generate volume profiles for each session, with default time ranges of 08:00–16:00 UTC for London and 13:00–21:00 UTC for New York, both adjustable by the user. The indicator plots horizontal trend lines representing the POC for the last five days, with customizable parameters including session start/end times, profile resolution (rows), and the number of days back to display (1–30). The POC levels are visualized as blue lines for the London session and orange lines for the New York session, serving as potential intraday support and resistance levels. This tool provides volume-based key levels to assist traders in market structure analysis.
Indicator profile
Indicator category
Volume
Output type
Visualisation
Data requirements
Bars only
Volume
Supported signals
Level touch
Level break
Session opening range

Customer reviews

0.0
Reviews: 0
Customer reviews
No reviews for this product yet. Already tried it? Be the first to tell others!

Discussion

FAQ

Key Levels
Volume
Support & Resistance
Products available through cTrader Store, including trading bots, indicators and plugins, are provided by third-party developers and made available for informational and technical access purposes only. cTrader Store is not a broker and does not provide investment advice, personal recommendations or any guarantee of future performance.

More from this author
Indicator
Fair Value Gap
Liquidity Sweep
Stop trading fake FVGs. Shows FVG ONLY after PDH/PDL Liquidity Sweep. SMC - No Repaint, Cloud Safe.
Indicator
Drawdown Monitor
Protect your funded account. Real-time Daily Equity Drawdown monitor with Green / Orange / Red flashing alerts.
cBot
Prop Firm Fit
Spread Filter
+1
News risk controller. Auto-pauses trading around high-impact events with customizable filters.
cBot
Break Even
Low Drawdown
+1
EURUSD H1 trend bot, 5-year test, 3.87% equity DD, PF 2.01, no martingale
2.01
Profit factor
Indicator
Fair Value Gap
Liquidity Grab
+2
PRO Liquidity Sweep + FVG Combo detector with custom Gold/Blue signals & alerts
cBot
ATR
Prop Firm Fit
Advanced volatility filter. Automatically pauses trading around important economic news events.

You may also like

Indicator
AI
ATR
+27
The Professional “All-in-One” Trading Suite (buy and sell indicator)
Indicator
Prop
Institution-level trend Analyzer.
Indicator
ATR
RSI
+5
Multi-factor VWAP mean-reversion signals with ATR bands, volume exhaustion, and RSI gate on cTrader.
Indicator
Prop
Scalping
Shows bars from different Time Frame on zoom out and hides the current bars. Perfect tool for Multi TF "Market Reply"
Indicator
AI
ATR
+27
Support and Resistance with signals
Indicator
RSI
Forex
+6
What Constance Brown did with the RSI was to input a momentum calculation within the RSI itself. This the Composite RSI.
Indicator
Forex
Fibonacci
+2
Enhance your trading with customizable alerts and dynamic visual tools for trendlines, Fibonacci levels, and more.
Indicator
SMC
Forex
+5
Pinpoint FVGs, track fills and see mitigation stats — trade imbalances with clarity and confidence.
Indicator
SMC
Signal
+2
Gold Market Maker Zones; Non-repainting Supply & Demand detector for XAUUSD. Precise institutional zones for cTrader.
Indicator
AI
ATR
+26
SR Commander — Multi Timeframe Edition. See where the big money draws the line. Trade on your timeframe. Think on theirs
Indicator
ZigZag
Indices
+2
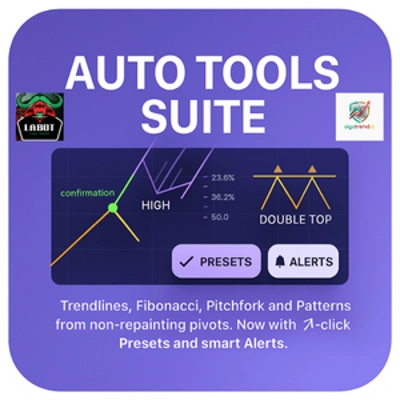
Auto Trendlines, Fibonacci, Pitchfork and Patterns from non‑repainting pivots. One‑click Presets, targeted Alerts, and a
Indicator
ADX
ATR
+2
GOLD SENTINEL v1.0 - A CANDLE-COLORING INDICATOR FOR GOLD.
Indicator
ADX
ATR
+5
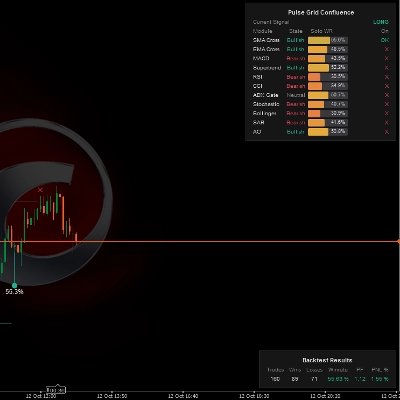
Multi-indicator confluence HUD & real-time backtest engine to detect trend alignment and filter high-probability setups.
Indicator
ADX
ATR
+5
10 Factors. One Signal. Zero Guesswork.
Indicator
Volume
Key Levels
View tick activity across a selected chart range with Point of Control, Value Area High and Value Area Low.
Indicator
ATR
MSS
+5
Advanced market structure and institutional cycle mapper with visual reference cards and entry alerts
Indicator
This indicator is a valuable tool for traders looking to identify significant opening price level of any asset.
Indicator
EURUSD
GBPUSD
+1
An exponential moving average based on regular trading hours.

Price

353.2M
Traded volume
2.78K
Pips won
31
Free installs