Penerangan
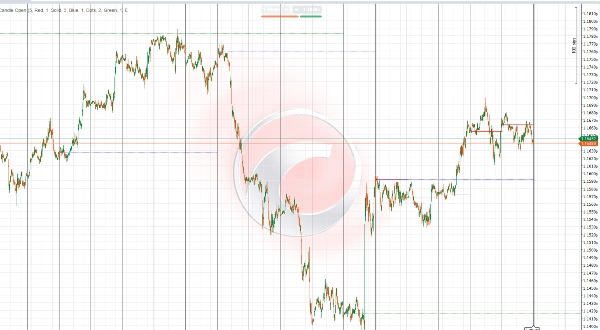
Penunjuk Buka Lilin IR adalah alat serbaguna dan boleh disesuaikan yang memplot harga pembukaan lilin mingguan, harian, dan bulanan pada carta dagangan anda. Pedagang boleh memilih bilangan tempoh (hari, minggu, bulan) untuk dipaparkan, membolehkan analisis pelbagai jangka masa yang fleksibel disesuaikan dengan strategi mereka.
Ciri-ciri utama termasuk:
- Plot yang tepat bagi pembukaan lilin untuk bilangan tempoh harian, mingguan, dan bulanan yang ditentukan pengguna.
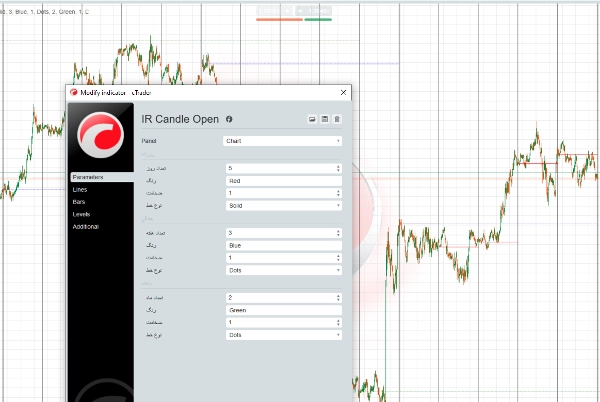
- Gaya garis yang boleh disesuaikan: pengguna boleh memilih jenis garis (pejal, putus-putus, bertitik), warna, dan ketebalan untuk keterbacaan carta yang lebih baik.
- Menyokong visualisasi pelbagai jangka masa untuk membantu mengenal pasti tahap harga penting merentasi horizon masa yang berbeza.
- Membantu dalam mengenal pasti zon sokongan dan rintangan yang berpotensi berdasarkan harga pembukaan kritikal ini.
- Serasi dengan pelbagai pasaran seperti Forex, komoditi, indeks, dan mata wang kripto.
Fleksibiliti ini membolehkan pedagang menyesuaikan paparan penunjuk mengikut keutamaan peribadi dan gaya dagangan mereka, meningkatkan kejelasan dan memperbaiki pembuatan keputusan berdasarkan tahap harga penting.
توضیح فارسی (بهروز شده)
اندیکاتور IR Candle Open ابزاری منعطف و قابل تنظیم است که قیمتهای باز شدن کندلهای هفتگی، روزانه و ماهیانه را روی نمودار معاملاتی شما نمایش میدهد. کاربران میتوانند تعداد دورههای روزانه، هفتگی و ماهیانه که میخواهند خطوط آنها نمایش داده شود را انتخاب کنند تا تحلیل چندتایمفریمی متناسب با سبک معاملاتی خود داشته باشند.
ویژگیهای کلیدی:
- نمایش دقیق خطوط قیمت باز شدن کندلها برای تعداد دورههای دلخواه در تایمفریمهای روزانه، هفتگی و ماهیانه.
- امکان انتخاب نوع خط (ساده، خطچین، نقطهچین)، رنگ و ضخامت خطوط برای بهبود وضوح و خوانایی نمودار.
- پشتیبانی از تحلیل چندتایمفریمی جهت شناسایی سطوح مهم قیمتی در بازههای زمانی مختلف.
- کمک به تشخیص سطوح حمایت و مقاومت احتمالی بر اساس این نقاط کلیدی باز شدن قیمتها.
- مناسب برای استفاده در بازارهای مختلف مانند فارکس، کالاها، شاخصها و رمزارزها.
این قابلیتها به تریدرها امکان میدهد تا نمایش اندیکاتور را بر اساس سلیقه و سبک معاملاتی خود تنظیم کنند و با وضوح بیشتر، تصمیمات بهتری بگیرند.
Ringkasan
Ulasan pelanggan
5 | 100 % | |
4 | 0 % | |
3 | 0 % | |
2 | 0 % | |
1 | 0 % |