
MACD x Volume Profile
Indikator
Versi 1.0, Jul 2026
Windows, Mac
Sejak 21/02/2026
17.43M
Volum yang didagangkan
2.85K
Pip dimenangi
1
Jualan
Penerangan
The MACD x Volume Profile adalah penunjuk lapisan tersuai cTrader (cAlgo) yang direka untuk memberikan pedagang pandangan dua perspektif mengenai tren pasaran dan kecairan. Dengan menggabungkan elemen asas penunjuk MACD dengan Profil Isipadu dinamik, ia membolehkan pengguna menganalisis momentum bersama-sama zon penerimaan harga sejarah terus pada carta utama.
Ciri Utama:
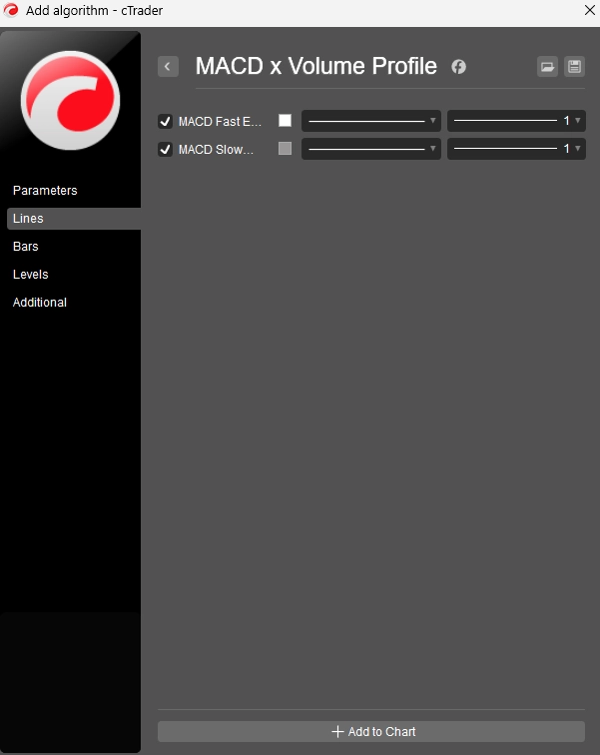
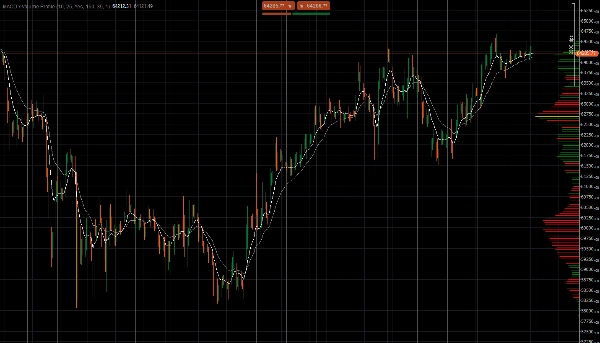
- Purata Pergerakan Eksponen Berganda (EMAs): Memaparkan EMA Pantas (lalai 10) dan EMA Perlahan (lalai 25) terus pada carta harga. Persilangan dan pemisahan garis ini membantu mengenal pasti arah tren jangka pendek dan jangka panjang serta momentum, membentuk asas analisis MACD standard.
- Profil Isipadu Julat Boleh Dilihat Dinamik (VRVP): Penunjuk ini mengira dan melukis profil isipadu secara dinamik berdasarkan hanya bar yang kelihatan pada carta anda. Ia secara automatik mengira semula dan melaraskan apabila anda menatal, mengecilkan, atau mengubah saiz tetingkap carta.
- Penonjolan Titik Kawalan (POC): Tahap harga dengan isipadu dagangan tertinggi (POC) ditonjolkan dengan jelas menggunakan garis kuning yang lebih tebal, membolehkan anda mengenal pasti dengan segera kawasan sokongan atau rintangan terkuat dalam pandangan semasa anda.
- Pewarnaan Isipadu Berarah: Garis isipadu dikodkan warna untuk menunjukkan tekanan beli atau jual. Jika bin harga mengalami lebih banyak isipadu semasa lilin bullish (Tutup ≥ Buka), ia mewarnakan garis profil hijau. Jika isipadu bearish menguasai, ia mewarnakan garis merah.
Penyesuaian Parameter:
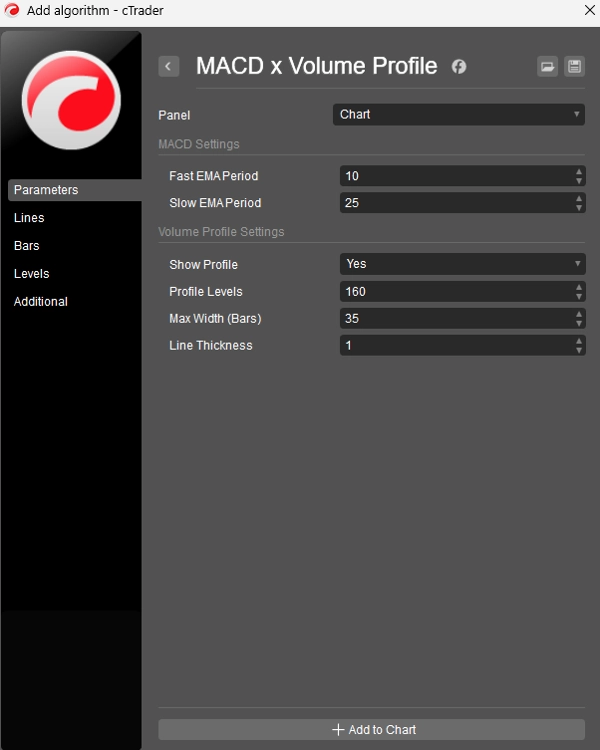
- Tetapan MACD: Tempoh yang boleh disesuaikan sepenuhnya untuk kedua-dua EMA Pantas dan Perlahan.
- Ketepatan Profil: Parameter tahap Profil membolehkan anda melaraskan resolusi profil isipadu (dari 10 hingga 200 baldi harga).
- Penyesuaian Visual: Pengguna boleh menghidupkan atau mematikan keterlihatan profil, mengukur lebar maksimum pada skrin, dan melaraskan ketebalan garis untuk memastikan carta bersih dan disesuaikan dengan keutamaan visual mereka.
Ringkasan
AI summary
The MACD x Volume Profile is a cTrader (cAlgo) overlay indicator that integrates the MACD's Fast and Slow Exponential Moving Averages (EMAs) with a dynamic Volume Profile on the main price chart. It displays a Fast EMA (default 10) and Slow EMA (default 25) to help identify trend direction and momentum through their crossings and separations. The Volume Profile dynamically calculates volume distribution based on the currently visible bars, updating automatically with chart navigation. The indicator highlights the Point of Control (POC)—the price level with the highest traded volume—using a distinct yellow line to mark key support or resistance zones. Volume bars are color-coded green or red to indicate buying or selling pressure, respectively. Users can customize MACD periods, adjust the granularity of the volume profile (10 to 200 price buckets), and modify visual settings such as profile visibility, width, and line thickness to suit their preferences. This tool combines momentum analysis with liquidity visualization to support trading decisions.
Profil indikator
Kategori indikator
Volum
Jenis output
Visualisasi
Keperluan data
Volum
Isyarat yang disokong
Kekuatan trend
Ulasan pelanggan
0.0
Ulasan: 0
Ulasan pelanggan
Belum ada ulasan untuk produk ini. Anda sudah mencuba produk tersebut? Jadilah yang pertama untuk berkongsi pendapat anda!
Perbincangan
Soalan Lazim
EMA
Volume
MACD
Moving Average
Produk yang tersedia melalui cTrader Store, termasuk bot dagangan, indikator dan plugin, disediakan oleh pembangun pihak ketiga dan diberikan akses untuk tujuan maklumat dan teknikal sahaja. cTrader Store bukan broker dan tidak memberikan nasihat pelaburan, syor peribadi atau sebarang jaminan prestasi masa hadapan.
Lebih banyak produk daripada penulis ini




















Harga
Sejak 21/02/2026
17.43M
Volum yang didagangkan
2.85K
Pip dimenangi
1
Jualan